Introduction
Menstruation encompasses phases involving alterations to the endometrial lining of the uterus and the ovarian follicles [1]. The phases are separated into two cycles, with the ovarian cycle alternating between the follicular and luteal phases and the uterine cycle consisting of menstruation and proliferative and secretory phases [2].
The follicular phase begins on the first day of menstruation and ends when an immature egg is released from one of the ovaries during ovulation. A fluid-filled sac, the follicle, houses immature eggs in the ovaries during the follicular period.
Ovarian follicles mature throughout the follicular phase, readying one of them for release during ovulation. Since the endometrium changes at the same time, the follicular phase is often referred to as the proliferative phase.
During the menstrual cycle, there are notable periodic fluctuations in the serum levels of sex hormones. The spinal and pelvic tissues may be affected by these hormones, and the frequency of back pain may change throughout the menstrual cycle. According to research, 75–90% of women report feeling uncomfortable during their periods, with 42–60% reporting moderate-to-severe pain [3]. Menstrual low back pain (MLBP) is the third most common type of menstrual discomfort, reported by 46–56% of women [4]. Some women experience period discomfort during the first few days of menstruation, which may extend from the belly to the upper thighs and back, and hormonal birth control may alter the menstrual cycle.
During the follicular phase of the menstrual cycle, muscular relaxation dramatically increases [5]. Furthermore, oestrogen receptors present in the anterior cruciate ligament (ACL) may have an impact on ligament elasticity. ACL effects can occur when oestrogen levels peak during the menstrual cycle, which can affect postural stability [6].
Persistent pelvic pain affects up to one in four women [7, 8], and almost all women experience pain during menstruation [7, 8]. The effects of pelvic pain on worthwhile endeav-ours, connections, and intimacy are thought to be the cause of the significant inverse relationship between pelvic pain sufferers’ quality of life and their level of discomfort [9].
The ability to maintain the centre of mass, the stability limit, is referred to as postural stability. The greatest deflection of the body from a vertical midline posture without losing balance is known as the limit of stability (LoS) [10]. Since oestrogen can impact the neuromuscular system directly and indirectly, it can have a substantial influence on postural stability and muscle coordination, which may be due to pelvic pain, increased connective tissue elasticity, and ACL ligament thinning [11].
Subjects and methods
Sample size calculation
The sample size was calculated before the investigation using G*power 3.1.9 (Heinrich-Heine-University, düsseldorf, Germany). Power (1-b error probability) was 0.95, effect size (p) was 0.3, and type i error was = 0.05, according to t-tests (Point-Biserial Correlation). As such, the minimum expected sample size was 85.
Participants
The study included a single group of 85 eligible females aged 18 to 22 years who were unmarried and experienced pelvic pain, low back pain, or postural instability throughout the follicular phase of the menstrual cycle. All participants had a body mass index (BMi) between 19 and 24 and were university students exposed to daily stress and activities during their menstrual cycle.
Patients with lumbar spondylosis, lumbar disc prolapses, sacroiliac joint arthritis, low back trauma, and a BMi of more than 24 were excluded.
Outcome measures
The Biodex Balance System (BBS) assessed postural stability, the functional back pain scale (FBPS) measured low back pain, and the functional pelvic pain scale (FPPS) evaluated pelvic pain.
Functional pelvic pain scale
The FPPS is a behavioural pain intensity category rating scale involving a self-reporting questionnaire listing a series of activities of day-to-day living (bladder and bowel function, intercourse, walking, running, lifting, working, and sleeping). Patients report their pain intensity as it relates to each function [12]. The FPPS has a 32-point rating scale, with the highest score achieved indicating the patient’s full extent of physical infirmity. Additionally, there is an adjusted score that ranges from 0 (0%) (no pain and normal function) to 32 (100%) (pain prevents functioning) [13].
Back pain functional scale
The BPFS is an arbitrary scale used to gauge a patient’s physical function following low back pain. it is straightforward and easy to comprehend and provide to patients. The scale has a maximum score of 60 and is based on the World Health organization’s international Classification of Functions (ICF). Responses to the BFPS are based on a Likert scale (0 to 5), with the patient’s highest score reflecting their greatest physical potential. An adjusted score, which ranges from 0 (0%), an inability to complete any work, to 60 (100%), no trouble in any activity, is also included [14].
Biodex balance system
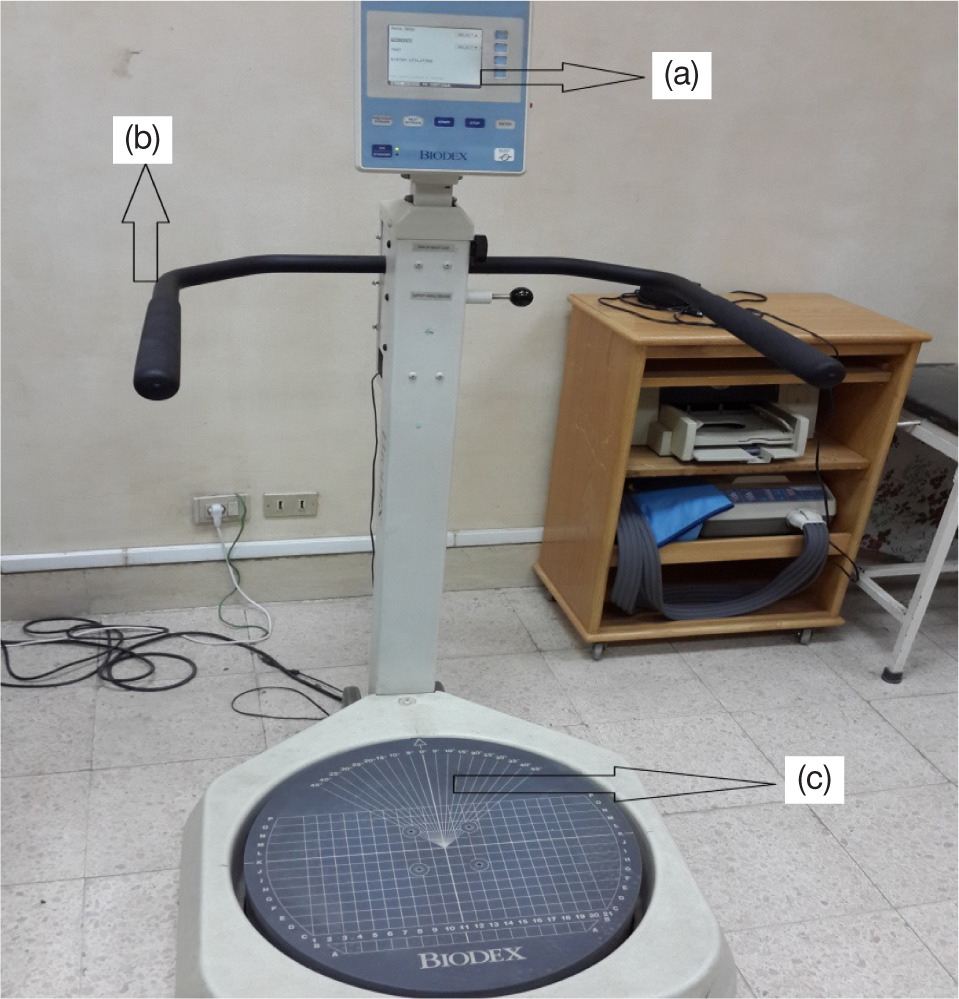
The BBS (Biodex Medical System, inc., NY, USA) measures postural stability and features a multiaxial standing platform that can be adjusted to produce different levels of platform tilt or instability (Figure 1). The system allows up to 20° of foot platform tilt, which permits the ankle joint mechanoreceptors to be stimulated maximally. The BBS measures, in degrees, the tilt about each axis during dynamic conditions and calculates a medial-lateral stability index (MLSi), anterior-posterior stability index (APSi), and an overall stability index (oSi). These indexes represent fluctuations around a zero point established before testing when the platform is stable. A high oSi score indicates poor balance, and the patient’s maximum overall score would be 1.60. The patient’s overall platform balancing ability is thought to be most accurately predicted by the oSi score. The device’s screen, which has a height-adjustable stand, and the curser, which shows the position and activity of the patient while attempting to preserve balance and stillness, are both accessible to the patient [15].
Figure 1
Biodex Balance System consisting of (a) display module, (b) support handle, and (c) force platform
Platform stability can be varied during this test by selecting (more options) from the postural stability testing screen. Trial time, number of trials, starting and ending platform stability, rest countdowns, and bilateral tests can be set.
When performing the postural stability test, the support handles and display height were positioned using the patients’ protocol, tilt was set for patient comfort, and data were recorded and entered, including name, age, height, and weight. The BBS offers eight levels of platform control and a static force setting, with level eight of the platform control selected in this study. The patient was positioned on the system and had the test protocol explained to them, after which they pressed start on the display to activate the cursor and moved it to the centre point on the grid.
Statistical analysis
SPSS version 28 (iBM Corp., NY, USA) was used for data management and statistical analysis. The Shapiro–Wilk test and direct data visualisation techniques assessed the normality of the quantitative data. The mean and standard deviation served as a summary of the quantitative data, while numbers and percentages represented the abridged forms of categorical data. Pearson’s correlation coefficient was used for correlation analysis. Each statistical test was two-sided, with significance set at p < 0.05.
Results
Patient demographic data
The study included 85 female participants, with mean values for age (20.36 ± 1.43 years), height (164.65 ± 7.57 cm), weight (60.16 ± 6.16 kg), and BMi (22.07 ± 1.68 kg/m2) shown in Table 1.
Descriptive statistics of all measured variables
Table 2 shows the descriptive statistics for all the variables measured.
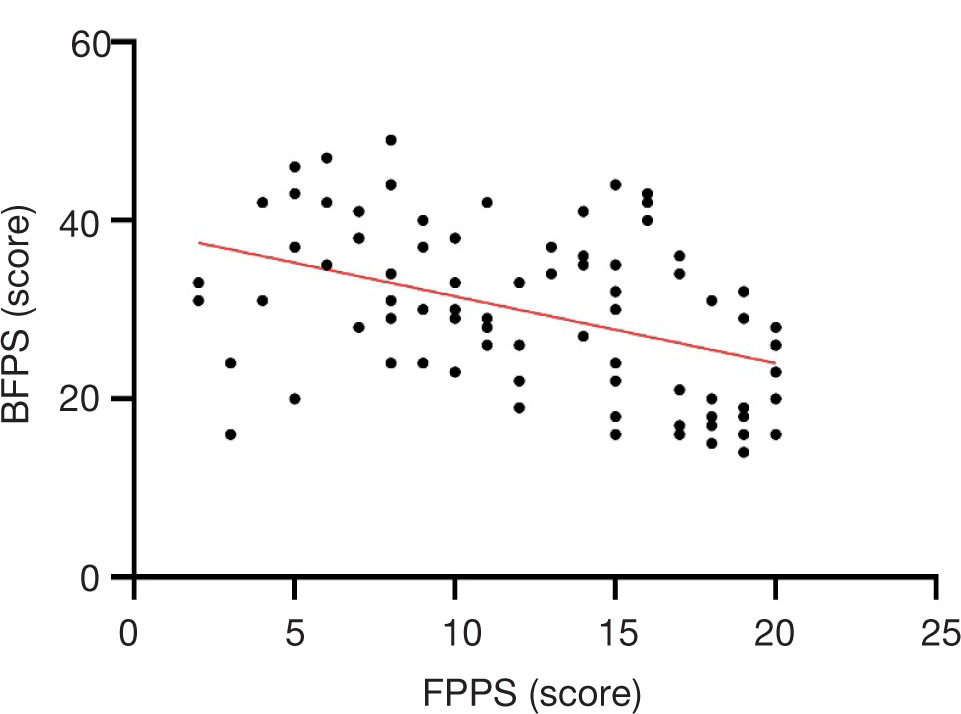
Correlation between functional pelvic pain scale, back pain functional scale, and overall stability index scores
Scores from the FPPS and BPFS had a moderately significant negative correlation (r = –0.437, p = 0.001). There was no correlation between the FPPS and oSi scores (r = –0.054, p = 0.625) or the BPFS and oSi scores (r = 0.143, p = 0.192), as shown in Figure 2 and Table 3.
Discussion
The current study examined the correlation between pelvic pain, low back pain, and postural stability in young and healthy menstruating women using the FPPS, BPFS, and BBS. The outcomes showed a significant moderate negative correlation between FPPS and BPFS scores. However, the FPPS and BPFS scores did not significantly correlate with the oSi scores.
Menstruation is a normal biological function that signifies a healthy reproductive system, but it can result in physical issues, as highlighted in this study. As such, young women must be aware of and skilled in managing premenstrual and menstrual symptoms [16].
Numerous studies have shown that severe menstruation symptoms make it difficult to carry out typical day-to-day activities and significantly affect university students’ quality of life and academic involvement [17].
According to recent research, compared to women without low back pain, women with low back pain had pelvic floor dysfunction. Such pelvic dysfunction and pelvic floor muscle weakness could lead to low back pain and an increased lumbar lordotic curve [18].
Young women who were exposed to everyday stress from tests and university activities during the follicular phase of the menstrual cycle had anterior pelvic tilting as a result of their posture, which exacerbated pelvic discomfort by increasing the lumbar lordotic curve and back pain as a compensatory measure.
All of the young women had a healthy BMi, participated in a variety of sports, and had normal muscle power. However, the pelvic and back pain they experienced during the follicular phase of the menstrual cycle did not influence their balance for the reasons previously indicated.
There were a number of drawbacks to this study, with some participants afraid of falling during the BBS test and others having to travel a considerable distance to get to the BBS test location since most hospitals and clinics lack a BBS.