Introduction
Wheelchair basketball (WB) is an intermittent sporting modality that involves actions interspersed with moderate to high intensity [1, 2]. WB athletes rely on different components of muscular fitness to perform sports-specific skills such as passing, shooting, dribbling, rebounding, and manual wheeling control in starting, stopping, propulsion, and rotating among other players on the court [3, 4]. To achieve these specific skills, WB athletes require either muscular strength, power, endurance, or even power endurance, the ability to sustain high-power output over an extended period, to meet the changing demands of WB sport during the game [5, 6]. Since WB athletes rely heavily on their upper extremities; exercise-induced fatigue may ultimately cause the muscles to be unable to produce force and generate power appropriately, resulting in fatigue-induced strength deficits, impairing athletic performance, and increasing the risk of overuse injuries [7–9].
Current evidence-based practices indicate that resistance training of the upper extremities significantly improves sprinting speed and agility performance in wheelchair athletes [1, 10, 11]. A previous study suggested that wheelchair sports depend on the muscular strength and power of the upper extremities, and these abilities should be developed through heavy resistance training [10]. The relationship between strength and speed in WB athletes also indicated that WB athletes who produce more power output are also able to accelerate faster and achieve higher speeds over short distances [11]. A similar improvement in sprinting speed and agility performance was also observed in WB athletes after a short-duration 6-week explosive strength training program in addition to WB routine training sessions [1]. Any athlete, with or without a disability, must engage in strength and conditioning programs that help in maximising their athletic performance while minimising the risk of sports-related injuries [10]. The strength and conditioning programs implemented in WB athletes should be tailored to their specific needs, not only targeting muscular strength or power but also a combination of power and endurance components. Greater muscular fitness is important for enhancing and maintaining optimum muscle function in WB athletes [1, 10–12]. In the normal progression of resistance training, athletes regularly develop muscular strength first, then power, and power endurance in the final stage during periodisation training [5, 13]. Power endurance (PE) is the ability to repeatedly perform a sport-specific skill with adequate speed. The primary goal of PE training is to increase muscle fatigue resistance and reduce lactic acid accumulation during repetitive movements. The PE training format uses intensity in the range of 30–60% of 1RM (one repetition maximum), 20–30 repetitions per set, approximately 2–4 sets, with maximum effort (lift with high velocity). This exercise prescription increases the muscle’ ability to generate glycolytic power (10–15 s) by enhancing the ability of the metabolic pathway to produce energy for contraction [5, 13]. Since speed is the attribute that differentiates winners from losers in sports, any training must be performed at or near competitive speeds [5]. This highlights that for power endurance training, it is optimal to duplicate, as much as possible, the speed and motion used in WB sport.
To the best of the authors’ knowledge, there is no research examining the effects of PE training on WB athletes. This research aimed to study the effects of PE training on upper extremity muscle function and athletic performance in Thai WB athletes. We hypothesised that performing PE training that mimics their WB functional movements would increase their ability to perform a sport skill repeatedly with adequate speed. To test this hypothesis, we compared power endurance (PE) training with power (PO) training according to the periodisation in the normal progression of resistance training.
Subjects and methods
Participants
This study was conducted on male and female Thai WB athletes. The purposive sampling technique was used to enrol all eligible participants from Thailand’s wheelchair basketball association. The inclusion criteria were as follows: (1) WB athletes of Thailand’s national wheelchair basketball team; (2) WB athletes aged 18–45 years; (3) WB athletes with physical disabilities, including neurological disabilities and musculoskeletal disabilities; (4) International Wheelchair Basketball Federation (IWBF) classification scores ranging from 1.0 to 4.5; (5) having been highly trained and regularly practicing WB at least 3 days a week during the first 3 months before the study; (6) having been playing wheelchair basketball for at least 1 year as a national or international player. The exclusion criteria were as follows: (1) having paraplegia from a spinal cord injury above the T1 level that may affect the upper extremity functions; (2) having undergone surgery on the shoulder or scapulothoracic regions; (3) having acute shoulder pain during the first 3 months before the study; and (4) having an abnormality in the joint adjacent to the shoulder, such as the elbow, wrist, or hand (congenital deformities, contractures, spasticity, etc.) that only affects the measurements. To reduce the influence of confounding factors, for WB athletes who could not participate in the required number of training sessions (80%), 10 sessions out of a total of 12 sessions were removed from the data analysis due to the drop-out criteria. The IWBF classification scores are 1.0, 1.5, 2.0, 2.5, 3.0, 3.5, 4.0, and 4.5 points, respectively. WB athletes could be classified into two functional categories (category A: 1.0–2.5 points, are usually WB athletes with greater physical disabilities from neurological disorders, while category B: 3.0–4.5 points, are usually those athletes with less pronounced physical disabilities from musculoskeletal disorders) [14, 15]. Each athlete has a unique score when examining trunk control/stability and functional movements related to wheelchair basketball as classification criteria. Only approved IWBF international and Thai national classifiers conducted these classifications. Higher scores are correlated with greater functional ability/ sport-related performance for the player on the court [16].
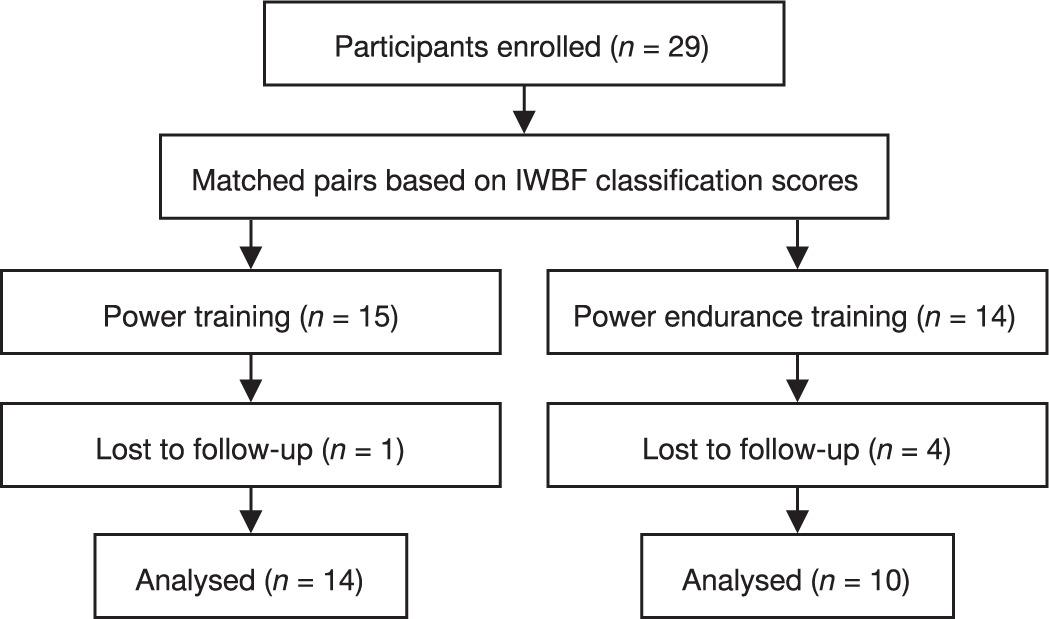
All WB athletes who met the inclusion criteria were first paired in a matched-pair parallel group design based on the IWBF classification scores, forming two non-equally sized resistance training groups: the power group (PO) (n = 15) and the power endurance group (PE) (n = 14). The study first recruited 29 participants aged 18–45 years. Since five participants could not participate until the end of the research, one participant from the PO group was requested to stop participating in the research due to a recovery from a post-surgical lower extremity; four participants from the PE group dropped out; two participants had personal medical conditions that were not affected by the interventions, and the other two did not complete the post-test measurements. The study was then implemented with 24 WB athletes. The study flow diagram of enrolled participants in a matched-pairs design is presented in Figure 1.
Research participant screening forms were used to collect the general information and baseline characteristics of all WB athletes. All characteristics were measured in a laboratory setting by the same experienced researchers. Weight was measured using a bioelectrical impedance analyser (Jawon Medical, Gyeongsan, South Korea) in a cross-sitting position. Height was measured using a stadiometer (Holtain Ltd®, Crymych, United Kingdom) in a supine lying position. The baseline characteristics of the participants are shown in Table 1.
Table 1
Baseline characteristics of participants (n = 24) (mean ± SD)
Resistance training protocols
Both groups underwent six weeks of upper extremities resistance training, twice weekly, but with a different training volume and load. The PO training was at 70–80% of 1RM, 5 sets of 4 repetitions (low-volume, heavy-load resistance training), while the PE training was at 30–40% of 1RM, 3 sets of 24 repetitions (high-volume, light-load resistance training). The inter-set rest was set at 5 min and 3 min for exercise stations due to the difficulty of ambulation and transfer among WB athletes. Exercise progression was set to increase by 5% of 1RM every two weeks. The 1RM values of six exercises were measured before the resistance training session, which consisted of bench press, shoulder press, prone bench pull, lat pulldown, bilateral shoulder internal rotation, and bilateral shoulder external rotation. All training sessions were supervised and monitored by the same experienced sports scientists, and the athletes were instructed to perform the speed of movement during weightlifting with maximum effort according to their resistance training protocols. All participants were instructed not to participate in any other type of upper extremities resistance training and to maintain their personal lifestyle and dietary habits but were strongly asked not to use any medications or anabolic agents. The resistance training protocols are presented in Table 2.
Table 2
Resistance training protocols for power and power endurance training
Muscle function tests
One repetition maximum tests: A 10 RM test was used to estimate the WB athletes’ 1RM; load repetition and number of repetitions were calculated using the Brzycki formula [17]. All WB athletes were engaged in a self-warm-up of 10 repetitions of each exercise with a submaximal load. After a 2-minute rest period, the athletes were instructed to perform as many repetitions as possible with a load that would prevent them from performing more than 10 repetitions. However, when they lifted beyond 10 repetitions, lifting was stopped for a new adjusted load of approximately 2.5–5 kg, and the athlete was given a rest period of 5 min. A maximum of three attempts were allowed within the session. An interval of 10 min of rest was used to change the exercises [1, 18].
Maximum number of repetitions to failure tests: The YMCA bench press and the prone bench pull tests were measured to represent the number of repetitions to failure of the upper extremities. Athletes were assigned to lie on their backs on an exercise bench. The knees were bent, and the soles of the feet were pressed against the flat surface of the floor. The athletes stretched their arms above their heads, about 2–3 cm wider than shoulder-width apart, to receive a barbell from the researcher. The athletes then moved the barbell back to their chest before performing the test (about 3 cm above the sternum). The weight of the barbell for men was 36 kg, and for women, it was 16 kg [19]. The researcher adjusted the speed of the metronome to 60 beats per minute. The athletes exerted force in a supine lying position and pushed according to the rhythm. The test ended when the athlete was unable to keep up with the pace of the metronome. Athletes were asked to breathe in and out normally to reduce stress during the test. While testing the number of repetitions to failure with the YMCA bench press test, a GymAware (GymAware Power Tool; Kinetic Performance Technologies, Canberra, Australia) was attached to the barbell [19, 20].
For the prone bench pull test, the athletes laid on their stomachs on a stable high bench and rested their chins and foreheads against a cushion. They held a barbell with their elbows straight, holding it 2–3 cm wider than shoulder width. The weight of the barbell for men was set at 40 kg [21], which was lighter in our research than the previous study on canoe paddler athletes [22], and for women it was 25 kg, which was slightly heavier than the previous study in collegiate women’s rowing athletes [23]. The researcher adjusted the speed of the metronome to 60 beats per minute, and the athletes exerted force in a prone-lying position and pulled according to the rhythm with their elbows bent backwards towards the ceiling until the barbell contacted the bottom of the exercise bench. They then moved the barbell to the starting position again without touching the ground below. The test ended when the athletes were unable to maintain the rhythm of the metronome. They were asked to breathe in and out normally to reduce stress during the test. Like the YMCA bench press test, a GymAware (GymAware Power Tool; Kinetic Performance Technologies, Canberra, Australia) was attached to one side of the barbell [24, 25] to monitor the maximum number of repetitions. We stabilised the athletes in both testing positions by placing belts around their lower chest, pelvis, and above-knee on the exercise bench.
Athletic performance tests
Sprinting speed was measured using a 20-metre sprint test without ball dribbling. Dual-beam electronic timing gates (Speedlight, SWIFT Performance Equipment, Lismore, Australia) were set at 0.5 m before the first timing gate (beginning line) and at 20 m (ending line). All the tests were performed three times, with 2 min of recovery in between. The best result of each trial was used for further analysis [1, 16].
Maximal medicine ball throw (overhead ball throw for distance) was used to measure the explosive power of the upper extremities. The WB athletes were instructed to begin in the middle of the baseline, with the front wheels behind the line, and throw a 5-kg medicine ball as far as possible from a stationary position [26, 27]. The distance was measured in metres; each athlete made only three attempts, and the best trial was used for further analysis [16, 28].
The pre- and post-tests were conducted in laboratories, weight training rooms, and basketball court settings. All WB athletes abstained from strenuous activity and consumption of alcohol, energy drinks, or caffeine for at least 48 hours prior to testing. Testing was conducted over three different sessions, separated by 48 hours within two weeks to prevent the incidence of confounding factors. In the first session, baseline characteristics measurements, data on general health, IWBF classification scores, types of physical disability, and years of experience in WB were recorded. In the second session, muscle function measurements were conducted in the weight training room. In the third session, athletic performance tests were measured on an indoor basketball court. Before each testing session, a standardised warm-up was undertaken by the athletes, who were instructed to perform all tests with maximum effort.
Statistical analysis
Research data are shown as mean ± standard error and coefficient intervals at 95% (95% CI). The Shapiro–Wilk test was used to analyse the distribution of data. Since some data were assessed as not normally distributed, Wilcoxon rank-sum tests were used to determine if there were differences between pre- and post-values for each group. A Mann–Whitney U test was used to determine if there were significant differences in the dependent variables between the two groups. For those categorical variables, the chi-square test was used to compare between the groups.
The data were normally distributed, a 2 (group) × 2 (time) mixed-design ANOVA was used to identify differences between pre- and post-tests and between groups. The least significant difference (LSD) test was used for post hoc analysis (pairwise comparisons: comparing simple main effects) when significant F ratios were detected. Statistical analyses were tested using the Statistical Package for the Social Sciences v. 29.0 (IBM SPSS Inc., Chicago, IL, USA). Statistical significance was set at p 0.05 for all tests.
Results
In the analysis of the 1RM values of the PO and PE groups, the Mann–Whitney U test revealed no significant difference between the two groups for the pre-test 1RM variables (p 0.05). The PO group showed a significantly higher increase in the 1RM values of the bench press, shoulder press, lat-pull-down, and bilateral shoulder internal and external rotation, except for the prone bench pull value, while the PE group showed a significant increase in bilateral shoulder internal and external rotation values after training (p 0.05). The Mann–Whitney U test also indicated that the post-test 1RM variables showed no significant difference between the two groups (p 0.05). The 1RM tests are presented in Table 3.
Table 3
1RM tests
In the analysis of the maximum number of repetitions to failure tests, the YMCA bench press test, which tests mean power/body weight (BW), there was a significant main effect of time on mean power/BW, F(1,22) = 5.37, p = 0.030, η2 = 0.196. The average mean power/BW was significantly higher in the post-test (M = 2.23, SD = 1.10) than in the pre-test (M = 2.09, SD = 0.98). There was also a significant interaction effect between time and group on the number of repetitions, F(1,22) = 5.70, p = 0.026, η2 = 0.213. The results revealed that the RTF of the YMCA bench press test in the PE group was significantly higher in the post-test (M = 29.00, SD = 12.70) than in the pre-test (M = 22.78, SD = 10.02).
For the prone bench pull test outcome measurements, there was a significant main effect of time on mean power/ BW, F(1,22) = 5.29, p = 0.031, η2 = 0.194. Mean power/BW was significantly higher in the post-test (M = 2.78, SD = 1.05) than in the pre-test (M = 2.58, SD = 1.06). There was also a significant main effect of time on peak velocity, F(1,22) = 5.82, p = 0.025, η2 = 0.209. Peak velocity was significantly higher in the post-test (M = 0.76, SD = 0.13) than in the pre-test (M = 0.71, SD = 0.14). Besides this, both groups also showed a significant main effect of time on peak power/BW, F(1,22) = 5.32, p = 0.031, η2 = 0.195. Peak power/BW was significantly higher in the post-test (M = 4.71, SD = 1.85) than in the pre-test (M = 4.38, SD = 1.86). Lastly, there was a significant main effect of time on the RTF of the prone bench pull test, F(1,22) = 5.37, p = 0.30, η2 = 0.196. The average number of repetitions was significantly higher in the post-test (M = 17.50, SD = 5.79) than in the pre-test (M = 15.29, SD = 6.23). The maximum numbers of repetitions to failure tests are presented in Table 4.
Table 4
Maximum number of repetitions to failure tests
There were no statistically significant differences between the two groups on the 20-metre sprinting time throughout the study (p 0.05). However, in the analysis of the maximal medicine ball throw, there was a significant main effect of time on the maximal medicine ball throw, F(1,22) = 33.74, p = 0.001, η2 = 0.616. The average distance was significantly farther in the post-test (M = 3.66, SD = 0.93) than in the pre-test (M = 3.33, SD = 1.04). All athletic performance variables are presented in Table 5.
Table 5
Athletic performance tests
Discussion
This study aimed to investigate the effects of power and power endurance training on upper extremity muscle function and athletic performance in Thai WB athletes. The results revealed that, for muscle function, PO training improved 1RM values greater than PE training, while PE training improved sustained submaximal muscle contractions during endurance repetitive movements until failure. A short-duration resistance program of power endurance training resulted only in significant increases in the RTF of the YMCA bench press test compared to power training. Besides this, there were no differences between the two training interventions regarding WB athletic performance.
Like other wheelchair athletes, those with musculoskeletal and neurological disorders cause WB athletes to lose muscle mass and increase fat mass of their total and regional body parts following a specific injury [15]. Regular physical activity is an effective strategy to maintain proper body composition in special populations [29–31]. Heavy resistance training has been shown to improve muscle strength, power, and physical performance in WB athletes [10]. It is well-documented that, regarding sets, repetitions, and % 1RM, the way athletes move a specific load during resistance training will result in different outcomes/adaptations [32, 33]. Both power and power endurance training played a major role in the transition phase, apart from the maximum strength period. Based on our results, the PO training showed a statistically significant improvement of overall 1 RM from baseline, except for the prone bench pull. The PE training showed no statistically significant difference of 1RM from baseline, except that bilateral shoulder internal and external rotation were found to be significantly improved. The intensity of the PO training (70–80% 1RM) is possibly able to increase in 1RM compared to the intensity of the PE training (30–45% 1RM), as a higher intensity can stimulate neural adaptations greater than a lighter intensity [34, 35]. Therefore, high- and moderate-intensity resistance training can improve muscle strength superior to that observed in light-intensity training [31, 36]. A previous study suggested that performing high-intensity (80% 1RM) resistance training can induce greater neural adaptations than low-intensity (30% 1RM) in a short period (3–6 weeks of training) [37]. Current evidence-based practice also indicates that completing just a single set of 6–12 repetitions using loads that range from 70 to 85% of 1RM and performing high-intensity training with maximum effort twice a week for eight to twelve weeks can achieve suboptimal but significant gains in 1RM [38]. Consequently, the PO training was able to develop greater muscular strength (1RM values) than PE training. In contrast, the intensity of the PE training (30–40% 1RM) is unlikely to have resulted in muscle hypertrophy, as is commonly observed in heavy resistance training. This may imply that the development of muscular strength was the result of neural adaptations because the training period was shorter than eight weeks and the intensity of the PE training was also lighter to induce morphological adaptations [1]. It is widely known that neural adaptations have a major role in the initial stages of strength training [39]. We assumed that the improvement in 1RM in both groups after 6 weeks of training was a result of neural adaptation mechanisms such as increased rate of activation of motor units, increased motor unit synchronisation, and decreased neural inhibition [40].
The prone bench pull (PBP) is the most used exercise in strength and conditioning programs to develop upper body pulling ability [25]. Our results revealed no statistically significant difference between the pre- and post-tests of the PBP 1RM in both groups. This exercise involves lying flat on a bench with a bar underneath the athlete, activating the latissimus dorsi and biceps brachii muscles to lift the bar and hit the bottom of the bench. For wheelchair athletes, this exercise is unlikely to be regularly performed due to the difficulty of transferring and ambulation to a high bench and the risk of falling. In a related point, we observed that some WB athletes in the PO group frequently lifted their chin up during the pull phase when they were nearly exhausted during the resistance training session. This indicated that the athletes were using their back extensors to lift the weight rather than the correct arm and shoulder muscles. This compensatory movement while pulling weight might explain the non-significant improvement when measuring the PBP 1RM of the PO group. The muscle endurance was assessed using a repetition to failure test [41]. The PBP test was conducted to represent muscle endurance of the back and shoulder musculatures. In wheelchair propulsion, the latissimus dorsi and posterior deltoid are used during the pull phase, and the biceps brachii is used in the push phase [42]. After training, there was a significant main effect of time on several variables of the PBP test during the maximum number of repetitions to failure test in both groups, indicating that both interventions might improve muscle function in a similar manner even though the PBP 1RM was not significantly improved. A study by Heyward et al. [43] suggested that when a wheelchair athlete is unable to control the movement of their shoulder blades (poor scapular control) or moves their shoulder blades less than normal (poor scapular kinematics), the scapular dyskinesia will directly affect athletic performance and increase the risk of injury [42, 44, 45]. We assumed that movements during the PBP and lat pulldown exercises enhanced the dynamic strength directly to the latissimus dorsi and biceps brachii, as well as the static strength indirectly to the trapezius, rear deltoid, teres major, and rhomboids. Consequently, this might help to strengthen the musculatures of the upper back, the scapular stabilisers, and the rotator cuff, ultimately contributing to improvements in 1RM values of the shoulder internal and external rotation in both groups from a proper position of the shoulder joint complex.
The YMCA bench press test is a time-efficient, safe, and multiple-joint assessment of upper-body muscular endurance [19, 20]. This test was conducted to measure the muscle endurance of the pectoralis major and anterior deltoid during the push phase and the triceps brachii during the pull phase in wheelchair propulsion [42]. The most important findings were that the PE training showed significantly higher increases in the RTF of the YMCA bench press test. Interestingly, we observed that the PO training showed a slight decline in the RTF test. Even though the 1RM of the PO training significantly improved by 5 kg after training, the PE training remained the same throughout the study period. We expected that the PE training would engage in practicing with a higher volume of training and a higher repetition (more endurance), whereas the PO training would engage with a higher load (more explosiveness). PE training might improve neural function by increasing the proportion of type IIA fibres, increasing the rate of force development, and maximising voluntary contraction. Therefore, movement efficiency and economy of movement were developed after training in the PE group [46, 47]. Resistance training exerted a major influence on neuromuscular capacity and a minor influence on anaerobic power and capacity [35], which may imply that power endurance training may influence both neuromuscular function and anaerobic capacity. This, in turn, raises the athlete’s lactate threshold, muscle fatigue resistance, movement efficiency, and economy while reducing lactic acid accumulation for sustained submaximal muscle contractions during endurance repetitive movements.
For WB athletic performance, there were no statistically significant differences between the two interventions on sprint speed. Our non-significant improvements in sprint speed values were lower than those of WB athletes in the study by Ozmen et al. [1], which may be related to a lower volume and intensity of training, and was not directly targeted/isolated in the biceps curl and triceps extension exercises of the upper arms as these two muscles play a major role during the push and pull phase of wheelchair propulsion [42]. WB athletes should employ these two exercises as supplementary exercises. The results of the speed test indicate that power training led to a slight improvement in speed; however, the change was not statistically significant. This limited progression may be attributed to a lack of progressive overload in the athlete’s training, particularly in terms of insufficient movement velocity or inadequate resistance. Consequently, the stimulus may not have been sufficient to elicit meaningful neuromuscular adaptations necessary for enhanced power development. A plausible explanation for the non-significant improvement could be the absence of velocity monitoring using an accelerometer or linear position transducer during the weightlifting, which may have provided valuable feedback for the WB athletes to optimise their training intensity and movement efficiency [32, 33]. Sprinting speed and change of direction (COD) performance are representative of specific movements observed in many sports [48]. We assumed that manual wheeling control is a sport-specific skill of WB functional movements. It inevitably affects sprint speed because each athlete may have different experiences/techniques using their wheelchairs. For the maximal medicine ball throw, the results indicated that there were no significant differences between the two training interventions. The PO and PE training in our study involved moderate-fast velocity training since explosive-like training can stimulate neural adaptations that are greater than the morphological adaptations [34, 35]. In the medicine ball throw, the latissimus dorsi and brachialis were the prime movers, while the abdominis, trapezius, and biceps brachii muscles were synergists [49]. The PBP 1RM (maximum strength) values were not improved, but the PBP RTF (explosive power) values improved after the training. Hence, both groups significantly increased the distance of the maximal medicine ball throw in a similar fashion. According to recent research, there were strong and perfect correlations between the medicine ball throw distance and the 20-metre sprint test in WB athletes [26]. This might help explain the non-significant improvement in sprinting speed performance after training.
Limitations
We acknowledge that our research has numerous potential limitations. Firstly, five participants dropped out; this reduced the statistical power and sensitivity of the partial eta-squared to detect the effect size of the training interventions on the outcome measurements. Secondly, with different resistance training principles and purposes, the training volume of the two interventions could not be adjusted equally. Thirdly, we lacked objective measures of the lifting velocity during the resistance training routine; however, we tried to limit these variations by using the same experienced sports scientists to monitor and supervise all the participants during the resistance training session. Fourthly, the participants were instructed to perform the maximum number of repetitions to failure tests according to a metronome; this might not truly represent the peak values obtained from the linear position transducer device. Finally, the COVID-19 pandemic among Thai WB athletes forced two weeks of total detraining, resulting in the post-test procedures being delayed. The clarity of the observed changes may ultimately be limited by the wide diversity in each person’s response to the upper body resistance exercise, differences in age, gender, and the IWBF classification scores. Therefore, when relating the results to only the functional category, the IWBF classification scores and athletic performance may differ and vary in each athlete.
Conclusions
Both power and power endurance training showed similar muscle function and athletic performance, suggesting that both interventions had a similar impact on the overall performances of Thai wheelchair basketball athletes after a short-duration 6-week explosive training program. Therefore, power (low-volume, high-load resistance training) and power endurance (high-volume, low-load resistance training) should be trained in a sequential order during the periodisation training, as power training affected muscle function (maximum strength) by increasing 1RM variables superior to power endurance training, while power endurance training affected muscle function (endurance) by helping athletes perform maximum repetitions with adequate speed until failure. To clarify the effects of the power and power endurance training, however, additional research implemented with velocity-based training (VBT) is required.