Introduction
Flatfoot, or pes planus, is a foot condition characterised by partial or complete collapse of the medial longitudinal arch (MLA) [1] and is categorised into rigid and flexible flatfoot types based on MLA preservation in non-weight-bearing conditions [2]. individuals with flatfoot frequently experience a higher incidence of lower extremity discomfort and injuries compared to those with a normal arch foot [3]. Studies have demonstrated that, compared to individuals with a normal arch foot, those with flatfoot exhibit poorer postural control [4] and less stability during single-limb standing [5].
To address the issue of MLA collapse in individuals with flatfoot, two commonly employed methods are foot orthoses and lower-extremity strengthening exercises. Foot orthoses, whether custom-made or prefabricated, are typically placed on the medial plantar side of the shoe to reduce MLA collapse and control excessive foot pronation [6]. Various foot orthoses designs have been studied, but they yield different findings regarding their beneficial effects for individuals with flexible flatfoot. A meta-analysis showed that foot orthoses with arch support and neutral rearfoot posting had no significant impact on controlling excessive foot pronation [7]. An effective foot orthotic feature that reduces excessive foot pronation should be positioned at the medial forefoot and medial rearfoot [7].
Lower-extremity exercise strengthens the intrinsic and extrinsic foot muscles that support the MLA. The intrinsic foot muscles that play crucial roles in MLA stability include the abductor hallucis [8] and the flexor hallucis brevis [9], while the extrinsic foot muscle that contributes to MLA support is the tibialis posterior [10]. However, recent studies emphasise the importance of considering biomechanical linkages of the lower extremity in closed-kinetic chain activities. in this context, combined strengthening exercises that target the intrinsic and extrinsic foot muscles alongside proximal lower extremity muscles, such as the gluteus medius, have resulted in better improvements in MLA support than solely focusing on foot muscle exercises [11, 12]. A previous study demonstrated the association between gluteus medius muscle activity and abductor hallucis muscle activity in maintaining the MLA [13].
The current literature cannot definitively establish the superiority of foot orthoses or exercise interventions as they mostly compare foot orthoses to a combination of exercise and foot orthoses or exercise alone to a combination of foot orthoses and exercise. Studies directly comparing foot orthoses to exercise are limited. For instance, one study suggests that combining foot orthoses with intrinsic foot muscle exercises can increase the cross-sectional area of foot muscles that support the MLA more than using foot orthoses alone [14]. However, a recent study found no significant difference in MLA height between those using foot orthoses alone and those implementing intrinsic foot muscle exercises and foot orthoses [6]. Similarly, conflicting results arise when directly comparing exercise interventions to the use of foot orthoses, with one study finding no significant difference in MLA height [15], while another demonstrated greater MLA improvement with intrinsic foot exercises compared to foot orthoses [16]. The inconsistency in these results may be attributed to the diversity of foot orthoses and exercise designs employed across these studies. Furthermore, previous studies also noted insufficient reporting on the detailed design of foot orthoses. To date, the effectiveness of foot orthoses with medial fore-foot and medial rearfoot wedges, recommended by a meta-analysis, in individuals with flexible flatfoot has not been compared to lower-extremity strengthening exercises targeting intrinsic foot, extrinsic foot, and gluteus medius muscles.
The primary aim of this study was to compare the effects of lower-extremity strengthening exercises and foot orthoses on MLA stability indicators, including navicular drop and arch height index (AHi) [17, 18]. Additionally, plantar pressure, static balance, and dynamic balance were also assessed. We hypothesised that lower-extremity strengthening exercise results in more significant improvements in these parameters compared to foot orthoses. The findings would provide insights into choosing between foot orthoses and lower-extremity strengthening exercises for individuals with flexible flatfoot.
Subjects and methods
Participants
Participants were recruited at a physical therapy clinic between december 2022 and April 2023 through posters, direct contact, and social media channels. The inclusion criteria comprised age 18 to 39 years, since older age has been associated with a higher risk of falls [19], flexible flatfoot in both feet, a normal body mass index (18.5-22.9 kg/m2), and ankle dorsiflexion range of motion of at least 10° [20]. Flat-foot was defined as a navicular drop equal to or greater than 10 mm [21]. Exclusion criteria included pain in the lower extremities, prior lower extremity surgery, history of accidents or trauma in the lower extremities, lower extremity deformities, signs of neurological deficit in the lower extremities, scoliosis, and pregnancy.
Interventions
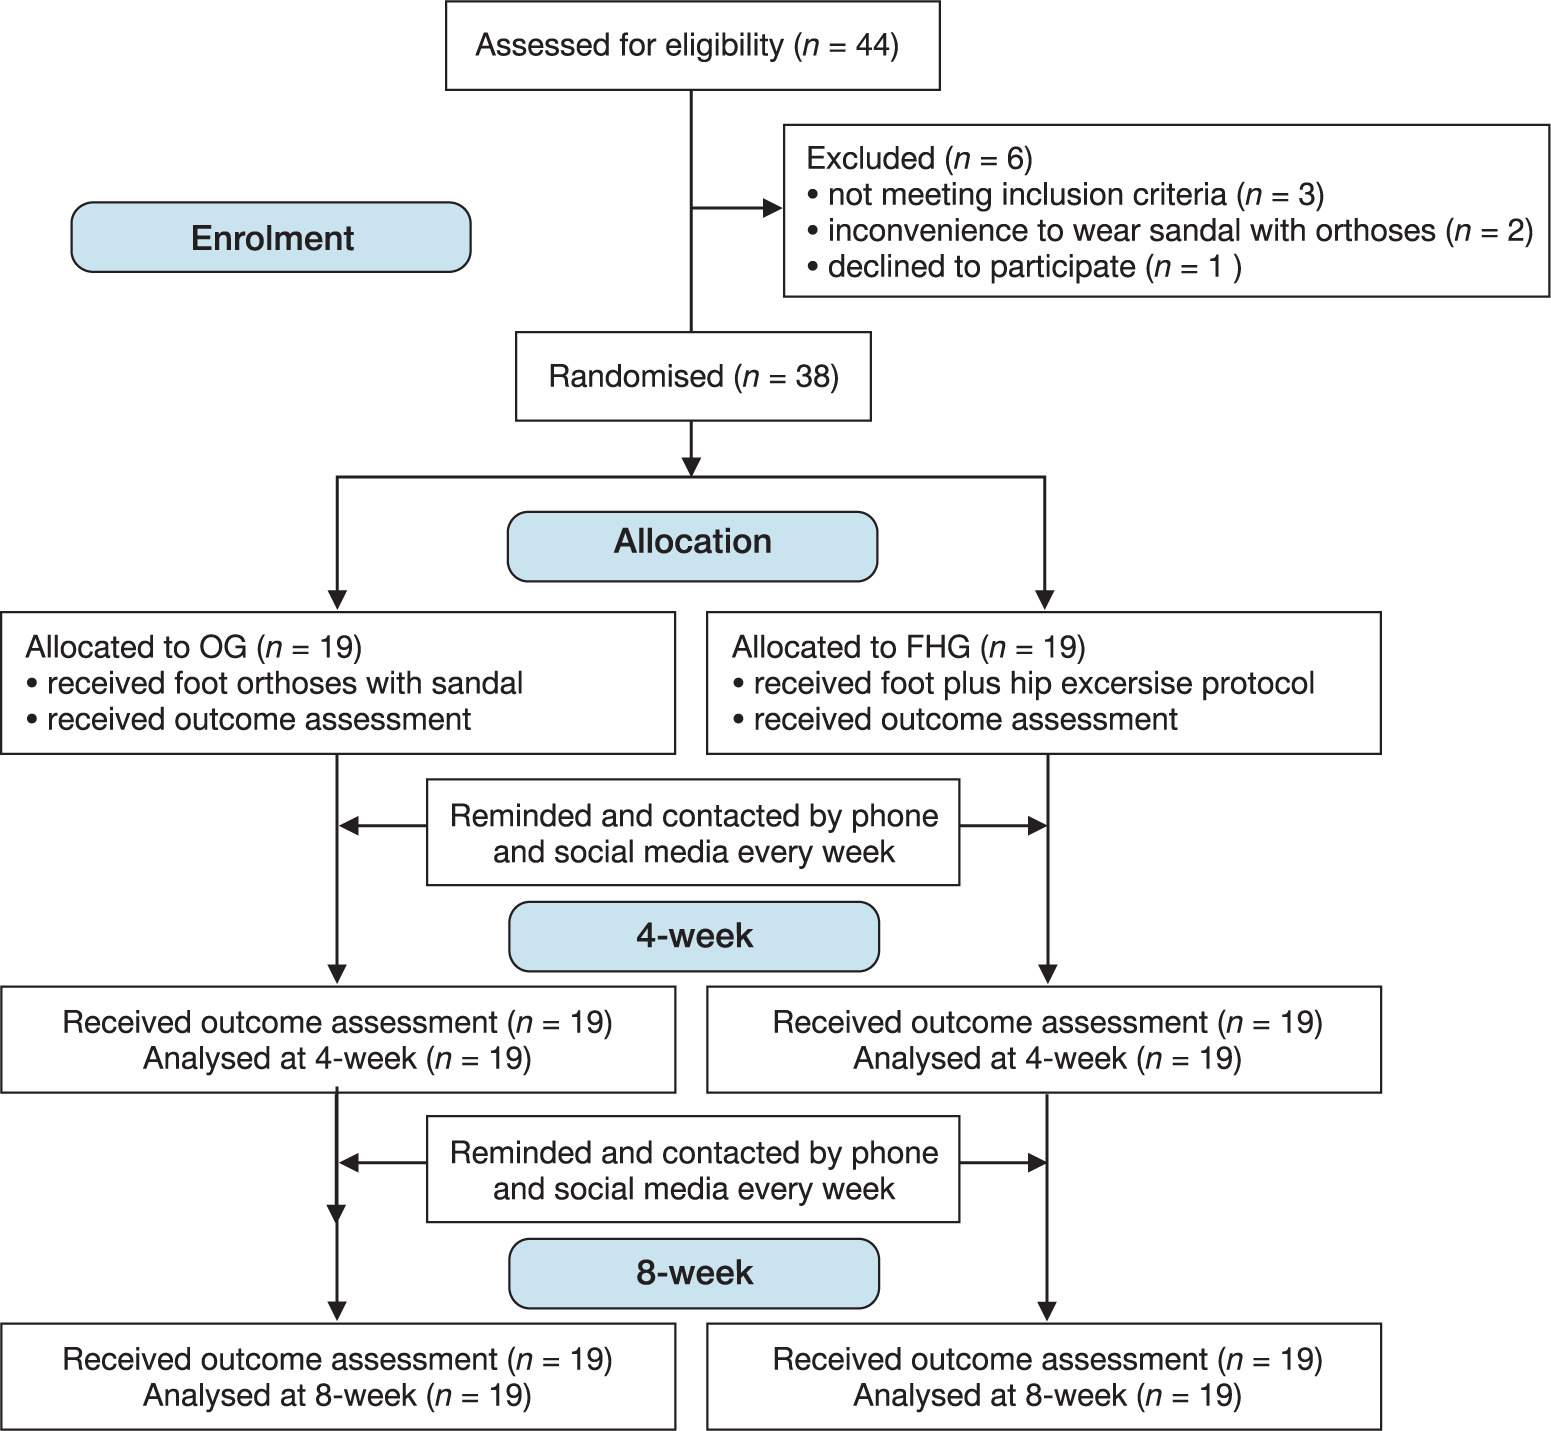
Participants who met the inclusion criteria were randomly assigned to the lower-extremity strengthening exercise group (EG) or the foot orthoses group (FoG) (Figure 1). Prior to the study, participants were informed that it included two group allocations, and due to the nature of the interventions, they were aware of their group allocation as it was not feasible to blind them from the intervention they received.
Outcomes were assessed at baseline in the following sequence: navicular drop, AHi, plantar pressure, static balance, dynamic balance, and muscle strength. Next, participants were familiarised with the exercises (EG) or foot orthoses (FoG) to ensure that they understood their assigned intervention and could follow it correctly. Both groups underwent an 8-week intervention, which was found to provide a sufficient duration for alterations in foot outcomes to occur from both interventions [6, 11]. All outcome measurements were repeated at four and 8 weeks. Throughout the study, both groups were asked to refrain from starting new lower-extremity exercises (other than those used in this study). A logbook was provided to all participants to record their compliance with the assigned intervention.
The EG group were instructed to perform an exercise program shown to improve the MLA to be performed for 5 days per week over an 8-week period and were given a pamphlet explaining the exercises. The exercises included foot and hip exercises (detailed in Table 1). The participants began exercises at an intensity level corresponding to their baseline muscle strength.
Table 1
Lower extremity exercise protocol and progressions
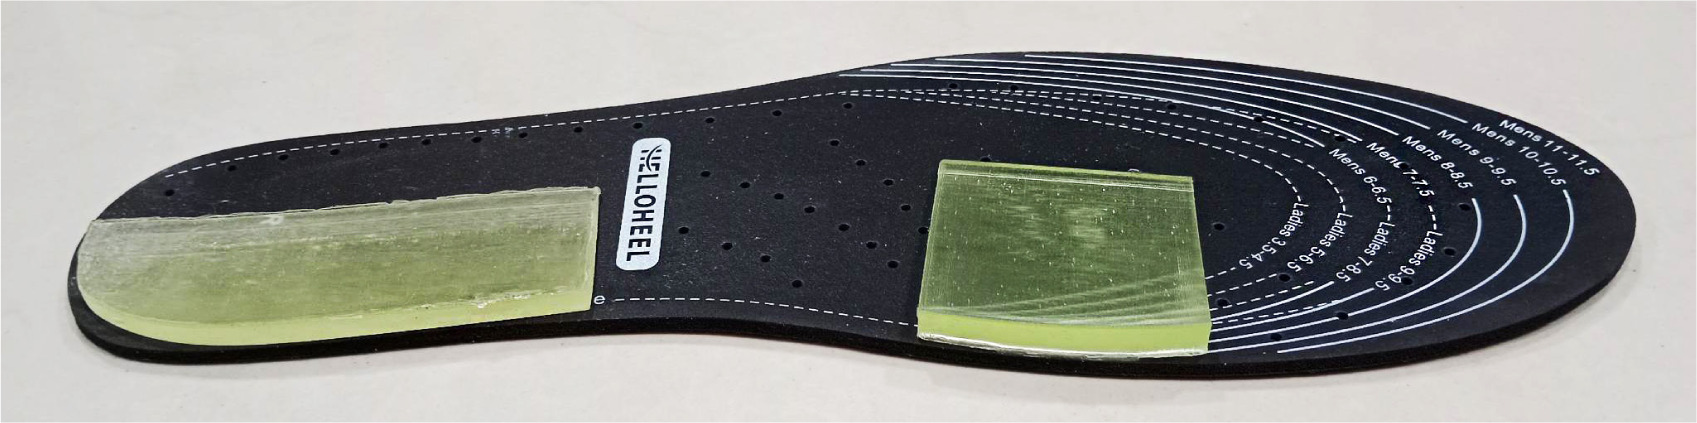
Participants in the FoG received a pair of adjustable sandals with 3.5 mm thick full-foot orthoses made of natural latex foam. These orthoses included two polyurethane wedges with a hardness of 40 shore A, which were placed on the me-dial forefoot and rearfoot as suggested by a meta-analysis (Figure 2) [7]. The configuration of these wedges was determined based on measurements of forefoot and rearfoot varus angles obtained from digital photographs taken while participants were in a prone position [22]. The medial forefoot wedge was set at 60 % of the forefoot varus angle, and the medial rearfoot wedge was set at 20 % of the rearfoot varus angle, with both wedges allowing for a maximum posting of 8° [23, 24]. Participants were instructed to wear these foot orthoses while weight bearing on their feet for at least five hours daily during daytime (6 am to 6 pm). This wearing duration aligns with the range reported for alterations in plantar pressure distribution and postural stability observed after applying foot orthoses for 6 weeks [6].
Two physical therapists were involved in the study, with one unaware of group allocations conducting evaluations of demographic information and outcome measures. The other therapist was assigned to fit the foot orthoses, instruct participants in exercise routines, and maintain regular weekly contact with participants via video call to guide exercise progression.
Outcome measures
Two primary and four secondary outcomes were measured. Before commencing the main study, a pilot study was conducted to test the intra-rater reliability of all measurements. The assessor reported excellent intra-rater reliability, with the intraclass correlation coefficient (iCC) ranging from 0.75 to 0.99 for all measurements.
Primary outcomes
The navicular drop was recorded as the difference in navicular height while participants stood barefoot with the subtalar joint positioned in both neutral and relaxed positions [25]. The subtalar joint neutral position was achieved by instructing participants to perform supination and pronation of each foot until an assessor could equally palpate the medial and lateral talar heads. A ruler was then used to measure the vertical distance from the most prominent palpable portion of the navicular tuberosity to the ground. Each foot measurement was conducted twice, and the average value was used for data analysis. This measurement has demonstrated excellent reliability (iCC > 0.90) and good correlation with footprint parameters (r > 0.60) [26]. in our study, excellent intra-rater reliability was established before commencing the experiment (iCC(3,2) = 0.97; standard error of the mean [SEM] = 0.34 mm). A higher navicular drop corresponds to poorer MLA stability [17].
AHI serves as an index of the MLA height, with a higher AHi corresponding to increased MLA height [18]. Participants stood on a block with one foot positioned in front of the other. An image was captured with a camera positioned 55 cm laterally from the foot, focusing on the navicular tuberosity. The AHi was calculated using Adobe Photoshop CC 2018 (Adobe inc., San Jose, CA) by measuring the ratio of dorsum height at 50% of the foot length to the distance between the first metatarsophalangeal joint and the posterior heel [27]. The average value obtained from two AHi measurements was used for analysis. This measurement has demonstrated excellent intra-rater reliability (iCC = 0.93) and high validity with radiography (ICC = 0.84) [28]. in our study, excellent intra-rater reliability was established before commencing the experiment (ICC(3,2) = 0.99 and SEM = 0.03).
Secondary outcomes
Plantar pressure was measured by the DIERS Pedoscan plate pressure (DIERS international GmbH, Schlangenbad, Germany) [15]. Participants stood barefoot with equal weight distribution on both feet at shoulder-width apart for 30 s while fixing their gaze straight ahead at a mark on the wall [16]. Pressure measurements were obtained from five regions, including the medial forefoot, lateral forefoot, midfoot, medial rearfoot, and lateral rearfoot. This procedure was repeated three times on each foot, with a 60-second interval between each repetition, and the mean value across the three attempts was used for analysis. The intra-rater reliability of this measurement was found to be excellent in this study (ICC(3,3) = 0.96 to 0.97).
Static balance was measured by the diERS Pedoscan Plate (DIERS international GmbH, Schlangenbad, Germany) [29]. Participants stood on one foot with their eyes closed, hands on the iliac crests, and the opposite knee flexed at 90° [30]. Displacement from the centre of pressure of the standing leg was measured in the anteroposterior and mediolateral directions [31]. Starting with the left, each leg was tested for three trials, each lasting 10 s, with a 60-second rest interval between trials [4]. The trial was repeated under the following conditions: contact of the non-standing foot with the floor, elevation of the standing leg from the ground, eyes opened, or either hand departing from the iliac crests [4]. The intra-rater reliability of this measurement was found to be excellent in this study (ICC(3,3) = 0.75 to 0.86). dynamic balance was assessed by a modified Star Excursion Balance Test of anterior, posterior, medial, and lateral directions [32]. Four tape measures, 150 cm each, were placed on the floor to form a cross shape. Participants stood at the centre of the cross, facing the anterior measuring tape, representing zero cm in all four directions (anterior, posterior, medial, and lateral). Starting with the left leg, participants extended as far as possible so that their big toe lightly touched one measuring tape at a time. The distance reached on each tape was expressed as a percentage of their leg length (from the anterior superior iliac spine to the medial malleolus) [32]. Half of the participants were randomised to touch each tape in a clockwise direction and the other half in a counterclockwise direction. A repetition of the test was required if the extending leg bore weight while in contact with the tape, lost contact with the tape for a minimum of 1 s, or if the standing leg lifted off the ground. The intra-rater reliability of this measurement was found to be excellent in this study (ICC(3,3) = 0.85 to 0.99).
Tibialis posterior, flexor hallucis brevis and gluteus medius muscle strength was measured using a handheld dynamometer (Jtech Medical industries, inc., UT, USA) following the standard manual muscle testing protocol [33]. To evaluate tibialis posterior strength, participants adopted a side-lying position on the tested side with the knee slightly flexed and the ankle positioned over the end of a table, ensuring a neutral alignment of the foot and ankle. An assessor stabilised the lower leg proximal to the ankle joint while applying resistance to foot inversion and plantarflexion along the medial border of the forefoot. For assessment of the flexor hallucis brevis muscle, participants were positioned supine with hips, knees, ankles, and toes maintained in a neutral position. An assessor stabilised the metatarsals while applying resistance to flexion of the metatarsophalangeal joint of the great toe. For testing of the gluteus medius muscle, participants were placed in a side-lying position with the non-tested leg flexed at the hip and knee to stabilise the trunk. The tested leg, on top, was in slight hip extension and neutral rotation, and participants performed hip abduction while avoiding hip flexion, hip internal rotation, and hip elevation. An assessor stabilised the anterior superior iliac spine while providing resistance to hip abduction on the lateral aspect of the thigh proximal to the knee. For all tests, the mean of three measurements was used for analysis. This study found excellent intra-rater reliability for these measurements (iCC(3,3) of 0.85 to 0.97).
Sample size
The sample size was determined using SPSS version 28.0 (iBM Corp., NY, USA) to identify a difference of 1.5 mm in navicular drop between the EG and FoG. The calculation used a statistical power of 0.85, a significance level of 0.05, and a potential dropout rate of 10 %. Based on an observed standard deviation of 1.4 mm from previous work [16], the current study required a sample size of 19 participants in each group.
Randomisation, concealment, and blinding
The study used a randomised, single-blind, prospective design, following the CoNSoRT flow diagram (Figure 1). Randomisation into either the EG or FoG employed a 1:1 allocation ratio using a computer-generated block randomisation table. The allocation process involved sequentially numbering and concealing assignments within opaque sealed envelopes to ensure outcome assessor blinding, and were revealed immediately before intervention.
Statistical analyses
Data were expressed as mean ± standard deviation, with the Shapiro–Wilk test assessing data normality. A two-way mixed analysis of variance (ANOVA) evaluated normally distributed data by comparing differences in each outcome measure between groups over time (baseline, 4 weeks, and 8 weeks). if significant interaction effects were detected, post hoc analyses with pairwise comparisons were conducted. For non-normal distributions, between-group and within-group comparisons were analysed separately. For within-group comparisons across time, the Friedman two-way ANOVA followed by pairwise comparisons was used to identify significant pairs. Baseline demographic variables and outcomes between the two groups were compared using an independent samples t-test or the Mann-Whitney U-test when the data did not conform to normality. The effect size index was calculated as Cohen’s d for normally distributed data and the rank-biserial correlation coefficient (r = Z/ N) for non-normally distributed data. data analysis was performed using SPSS version 28.0 (iBM Corp., NY, USA), with a significance level of p < 0.05.
Results
Thirty-eight participants completed the 8-week study, with no dropouts or adverse events reported. Some data were not normally distributed, as indicated in the tables. Within each group, no significant differences were observed between the left and right feet at baseline for any outcome measures. Therefore, data from both feet within each group were pooled for analysis. No significant between-group differences were found in baseline demographic characteristics (Table 2). Compliance level was excellent, with the EG demonstrating a mean of 35.5 ± 2.5 days (range = 32 to 40) out of the assigned 40 days and the FoG exhibiting compliance of 5.2 ± 1.0 hours per day (range = 4 to 7.5) out of the designated five hours.
Table 2
Demographic characteristics of participants in each group. data from both feet were combined
Tables 3 and 4 show all outcome measure data, with significant interactions between group and time observed for all outcomes except plantar pressure. Post hoc analyses revealed significant improvements from baseline in most outcome measures for the EG and the FoG at 4 and 8 weeks, except for plantar pressure in the midfoot region. Notably, there were no significant changes in the strength of the gluteus medius muscle in the FOG.
Table 3
Outcomes of foot orthoses and exercise groups by intervention and time, and comparisons between foot alignment and plantar pressure (foot orthoses [n = 38 feet] and exercise [n = 38 feet])
[i] AHI – arch height index * significant within group compared to baseline (p < 0.05), ** significant within group compared to baseline (p < 0.001) # significant within-group between 4 and 8 weeks (p < 0.05), † significant between groups (p < 0.05) , these outcomes exhibited non-normal distribution: Friedman two-way ANoVA and Mann–Whitney U-test
Table 4
Outcomes of foot orthoses and exercise groups by intervention and time, and comparisons between balance and muscle strength (foot orthoses [n = 38 feet] and exercise [n = 38 feet])
[i] AP – anteroposterior, MP – mediolateral * significant within-group compared to baseline (p < 0.05), ** significant within-group compared to baseline (p < 0.001) # significant within-group between 4 and 8 weeks (p < 0.05), † significant between groups (p < 0.05) , these outcomes exhibited non-normal distribution: Friedman two-way ANoVA and Mann–Whitney U-test
Comparing the EG to the FOG, the EG showed greater improvements in navicular drop, AHi, static balance in the anteroposterior direction, and strength of the tibialis posterior, flexor hallucis brevis, and gluteus medius muscles at the 4-week and 8-week measurements. Significant between-group differences were found for dynamic balance in the me-dial and lateral directions after 8 weeks of the intervention.
Discussion
Strengthening exercises targeting the lower extremities were more effective in enhancing the condition of flexible flat-foot in healthy adults compared to foot orthoses. The EG exhibited significantly greater improvements in navicular drop, AHi, static balance, and lower extremity muscle strength than the foot orthoses group at four and 8 weeks. The improvements from baseline were evident within each group after 4 and 8 weeks of intervention, with significant differences also observed between the 4-week and 8-week time points in many outcomes.
The reductions in navicular drop and increases in AHi in both study groups support the effectiveness of exercise and foot orthoses in preserving the MLA during weight bearing. At 8 weeks, both outcomes progressively approached the range typically reported in a normal arch foot (i.e., a navicular drop of 5 to 9 mm [30] and an AHi of approximately 0.34) [18, 27, 34]. in the EG, the reduction in navicular drop by 5.5 mm closely aligns with findings from previous studies that exercised gluteal and foot muscles for 6 to 8 weeks [11, 12]. With the repeated contraction of muscles that control the MLA in the EG, it is postulated that the muscular sensorimotor system might be activated, resulting in improved subtalar joint control, which prevents MLA collapse during weight bearing [35]. The greater reduction in navicular drop in the EG is consistent with a previous study demonstrating an improved navicular drop among those performing short foot exercises over those using foot orthoses for 5 weeks [16]. These results suggest that exercise is more effective than foot orthoses in aligning the tarsal bones to maintain the MLA during weight bearing in barefoot conditions.
In addition to improved MLA height, alterations in plantar pressure were observed compared to the baseline measurements. The EG and FoG exhibited reductions in forefoot and rearfoot pressure in the medial regions, accompanied by increases in the lateral areas. These shifts in pressure distribution align with the characteristic pattern observed in individuals with a normal foot arch, where the centre of pressure tends to be located more laterally compared to flatfoot individuals [36]. Nevertheless, it is worth mentioning that no plantar pressure differences were observed between the EG and FoG across all subregions of the foot. This suggests that the interventions are comparable in their effectiveness for improving plantar pressure in individuals with flexible flatfoot during double-leg standing. However, the pressure distribution might vary when there is more load on the foot in a single-leg stance or during gait. Therefore, further investigation into these aspects is warranted in future studies.
Participants in both study groups demonstrated marked improvements in static and dynamic balance across most directions following the intervention. in terms of static balance, these results align with prior research that reported reduced centre-of-pressure excursion during single-leg standing with closed eyes after engaging in lower extremity exercises [37] or using foot orthoses [38]. The observed dynamic balance enhancement within the EG and the FoG is also consistent with a previous study [16]. The mechanism for improving balance in the FoG might be explained by the ability of the foot orthoses to increase afferent feedback from the skin mechanoreceptors of the foot, which was found to improve ankle joint proprioception [39].
To date, no studies have directly compared the effects of exercises and foot orthoses on static balance. However, a study compared the effects of short foot exercises and arch support insoles on dynamic balance but reported no difference between the groups [16]. This finding contrasts with the current study findings of differences in dynamic balance between the EG and the FoG, particularly in the medial and lateral directions. This difference could be attributed to variations in the exercise interventions employed. The current study incorporated exercises targeting the intrinsic foot and hip muscles. dynamic balance tasks that involve reaching the leg as far as possible in various directions likely require strength in the foot muscles and the proximal muscles of the lower extremity. As a result, the increased strength observed in the foot and hip muscles in the EG may contribute to their superior dynamic balance performance compared to the FoG.
The increases in lower extremity muscle strength following strengthening exercises were anticipated. However, the improvements in tibialis posterior and flexor hallucis brevis muscle strength in the FoG are interesting when considering that foot orthoses are typically regarded as passive interventions. This finding is consistent with a study that required individuals to use foot orthoses for 8 weeks and found increases in flexor hallucis brevis muscle strength and abductor hallucis muscle cross-sectional area [14]. despite these gains, all muscles in the EG showed greater strength than those in the FoG at the 4-week and 8-week intervals.
When comparing the outcomes across time, most exhibited continuous improvements, from baseline and between 4 and 8 weeks. However, 3 outcomes showed significant improvements from baseline at 4 and 8 weeks but not between these two times. Among these outcomes, two were observed in the EG (plantar pressure in the lateral rearfoot and dynamic balance in the posterior direction), and one was noted in the FoG (static balance in the anteroposterior direction). These findings suggest that the changes in these outcomes might either progress slowly after 4 weeks of interventions or reach a plateau, making further improvement challenging with the current interventions.
This study confirms that lower-extremity strengthening exercises and foot orthoses effectively reduce navicular drop, improve plantar pressure distribution, and enhance balance among individuals with flexible flatfoot when applied daily over 8 weeks. Notably, the exercises exhibited greater improvements compared to the foot orthoses.
Limitations
Some study limitations should be acknowledged. First, the participants were pain-free, implying that the outcomes might vary in a symptomatic flatfoot population. Second, the long-term effectiveness of the interventions remains unknown since the participants were not followed up after the interventions ceased. Third, the study did not examine the impact of the interventions on functional activities such as walking and running. Fourth, the combined effects of foot orthoses and lower-extremity strengthening exercises were not investigated. Fifth, the maximum wear duration of foot orthoses was not controlled, which could affect the outcomes. Future research should address these limitations to provide a comprehensive understanding of interventions for flexible flatfoot.
Conclusions
Overall, this study demonstrated that lower-extremity strengthening exercises and foot orthoses can effectively enhance MLA height and balance in individuals with flexible flatfoot. Notably, the exercise group exhibited superior improvements than the foot orthoses group. These findings suggest that an active intervention, such as exercise, may offer greater benefits than a passive intervention.