Introduction
Heart rate variability (HRV) is a widely recognised measure of cardiac autonomic function, reflecting the dynamic interplay between the sympathetic and parasympathetic branches of the autonomic nervous system (ANS) [1]. Reduced HRV is associated with an increased risk of adverse cardiovascular events, including myocardial infarction, arrhythmias, and sudden cardiac death [2]. Traditionally, HRV is assessed during resting conditions. However, recent research has emphasised the importance of studying HRV recovery after exercise and cardiac parasympathetic reactivation as novel indices with potential prognostic value [3, 4].
Hrv recovery after exercise refers to the time course and extent to which HRV parameters return to baseline levels following a bout of physical activity (PA) and represents the ability of the ANS to restore balance and adapt to physiological stress imposed by exercise [5]. Cardiac parasympathetic reactivation, a component of HRV recovery, refers to the restoration of parasympathetic activity after sympathetic activation during exercise. The interplay between the sympathetic and parasympathetic branches plays a crucial role in cardiovascular regulation. Disturbances in this balance after exercise and delayed parasympathetic reactivation have been implicated in various cardiovascular disorders [3, 6].
The method for assessing HRV after exercise involves analysing the changes in HRV indices, including the parameters of the time domain [standard deviation of all normal to normal R-R (NN) intervals (SDNN) and the square root of the mean of the squares of successive NN interval differences [RMSSD] and frequency domain [low-frequency activity (LF), high-frequency activity (HF), and LF/HF ratio] [7]. Several fac tors affect HRV recovery after exercise, including age, sex, training status, and exercise intensity [8, 9]. interestingly, several studies have demonstrated that high-intensity exercise leads to a prolonged decrease in HRV and slower HRV recovery [5, 10]. Moreover, delayed HRV recovery is observed after high-intensity interval training (HiiT) [4].
However, the limitations of some HiiT protocols include high perceived exertion and low time efficiency. An alternative HiiT protocol has been developed, known as reduced exertion high-intensity interval training (REHiT) [11], that shows promising results in improving cardiovascular fitness [12-15]. Although previous studies have not reported adverse events during and after REHiT, sedentary individuals are more susceptible to acute cardiovascular events than physically active individuals [16]. Understanding HRV recovery and cardiac parasympathetic reactivation after REHiT is essential for prescribing exercise to individuals at risk of adverse cardiovascular events. Therefore, this study examined cardio autonomic recovery following REHiT and moderate-intensity continuous training (MiCT) in physically inactive adults.
Subjects and methods
Participants
Sixteen physically inactive males participated in this study (Table 1). To be eligible for the study, participants were regarded as “physically inactive” if they were not classified as moderately or highly physically active according to the international Physical Activity Questionnaire [17]. Participants were ineligible for inclusion if they exhibited any contraindications to exercise, as determined by the Physical Activity Readiness Questionnaire (Thai version) [18]. Additionally, smokers and those presenting with musculoskeletal disorders within the previous six months or other serious underlying diseases were excluded. Before participating in the study, all participants provided written informed consent. The sample size was calculated a priori. For statistical power of 80% at a significance level (a) of 0.05 and an effect size of / = 0.25, at least 13 participants were required. An additional 20% was added to account for potential dropout, resulting in a final sample size of 16.
Research design
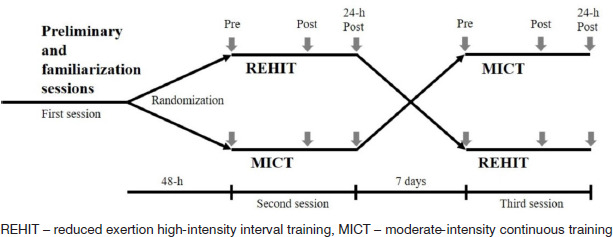
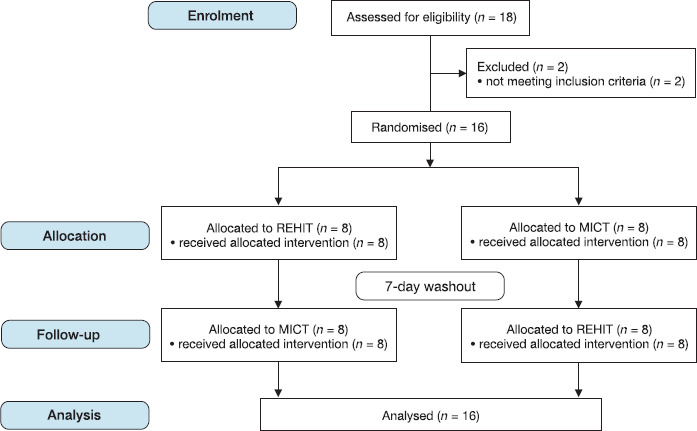
The study used a randomised crossover design (Figure 1). The Consolidated Standards of Reporting Trials (CONSORT) flow diagram (Figure 2) depicts the number of participants screened and eligible. Participants performed REHiT and MiCT 48 hours after the preliminary session, with the sequences in which the two exercises were performed randomly allocated. The research assistant performed randomisation using sealed envelopes to generate the list, which was concealed by the principal investigator. Pre- and post-exercise (immediately, 20 min, 40 min, 60 min, and 24 h) heart rate (HR), HRV, blood pressure (BP), and rating of perceived exertion (RPE) levels were measured. To minimise the influence of potential training effects, a seven-day interval separated the two exercise sessions. Participants were instructed to maintain their usual PA routines and record their daily activities, including the type and duration of each activity, during the week between exercise sessions. All experimental sessions were conducted in the morning under controlled laboratory conditions, with a temperature range maintained at 24-26°C at the Department of Physical Therapy, Faculty of Allied Health Sciences, Thammasat University, Thailand. Furthermore, the participants were explicitly instructed to refrain from engaging in vigorous PA and abstain from consuming caffeine or alcohol the day preceding each session.
Preliminary and familiarisation sessions
Body weight and body fat percentage were measured using a Tanita digital scale (BC 587 inner Scan Body Composition Monitor; Tanita Corp., Tokyo, Japan), while body height was measured using standard techniques. The Astrand-Ryh- ming method was employed to estimate the peak oxygen uptake (V02 peak) [19] using a Monark 874E bicycle ergometer (Monark, Vansbro, Sweden). HR was measured during exercise using portable HR monitors (Polar H10; Polar Electro, Kempele, Finland). After the completion of preliminary testing, participants were introduced to REHiT protocols with the aim of familiarising them with exercising at an all-out intensity level.
Reduced exertion high-intensity interval training
The REHiT protocol, described previously [14], consists of an unloaded cycling exercise protocol (10 min) on a cycle ergometer (Monark 874E; Monark, Vansbro, Sweden), commencing with a warm-up period (2 min). Subsequently, two all-out sprints (20 s) were performed with a braking force equivalent to 7.5% of body mass. A recovery period followed the initial sprint (unloaded cycling). Finally, a cool-down period (4-minute unloaded cycling) followed the second sprint.
Moderate-intensity continuous training
Mict (30 min) was performed using a cycle ergometer (Precor UBK 615; Precor, WA, USA). The exercise session commenced with a warm-up period (5 min), followed by 20 min of cycling at 40-59% heart rate reserve and a cool-down period (5 min).
Heart rate variability
The R-R intervals were measured using the Polar V800 HR monitor (Polar Electro, Kempele, Finland), the reliability of which was validated in previous HRV studies [20, 21]. To assess HRV pre-exercise, the participants were monitored for 20 min (in the morning between 8:00 and 9:00 AM) in the supine position in a quiet room with limited visual stimuli. The participants were instructed to remain quiet and still throughout the monitoring period. Post-exercise HRV was measured immediately after the exercise session and after 20 min, 40 min, 60 min, and 24 h.
For HRV analysis, R-R interval data were extracted and transferred to a computer via the Polar Flow web service. Kubios HRV software (version 3.4.1; Kubios, Kuopio, Finland) was used to perform HRV analysis, including the time domain (SDNN and RMSSD) and frequency domain (LF and HF) analyses.
Statistical analysis
A log transformation was applied to HRV variables to reduce bias from skewed distributions. The results were reported as mean ± standard deviation (SD). To analyse the differences between the two exercises, changes in HR, BP, HRV, and RPE, a two-way repeated-measures analysis of variance (ANOVA) was employed, considering the factors of time and exercise. in the event of significant results, post hoc comparisons were conducted using the Bonferroni test to further investigate specific differences. The level of significance was set at p < 0.05 for all analyses.
Results
Effects of exercise on heart rate and blood pressure
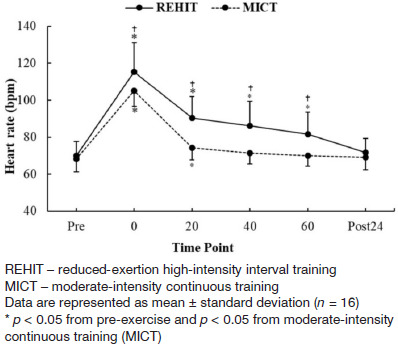
Hr increased significantly immediately after both exercise protocols (p < 0.05). interestingly, HR was higher following REHiT than MiCT protocols (p < 0.05). HR exhibited sustained elevation until 60 min post-REHiT (p < 0.05) and 20 min post- MiCT (p < 0.05) (Figure 3). Furthermore, the average peak HR during REHiT and MiCT were approximately 76.5 ± 8.4% and 57.5 ± 4.8% of the maximum HR, respectively.
Figure 3
Heart rate following reduced exertion, high-intensity interval training, and moderate-intensity continuous training protocols
Additionally, no significant difference in BP changes between the REHiT and MiCT groups was found at any time point (Table 2).
Table 2
Blood pressure responses following reduced exertion, high-intensity interval training, and moderate-intensity continuous training
Effect of exercise on heart rate variability
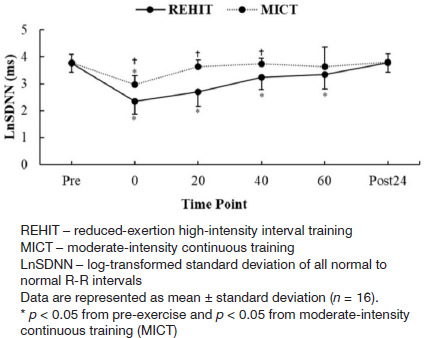
Log-transformed (Ln) SDNN significantly decreased immediately after REHiT and MiCT (p < 0.05). Moreover, LnSDNN was significantly lower immediately, 20 min, 40 min, and 60 min after REHiT than MiCT. Additionally, LnSDNN demonstrated a sustained significant reduction 20 min post-MiCT (p < 0.05) and remained significantly decreased 40 min post-REHiT (p < 0.05) (Figure 4).
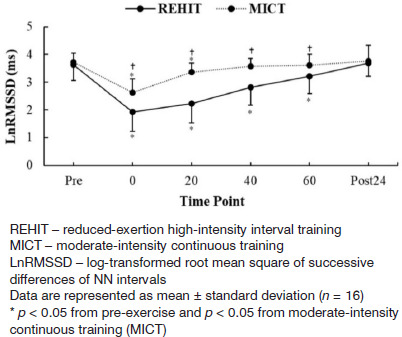
Lnrmssd showed similar changes to those observed in LnSDNN after both exercise protocols. However, LnRMSSD remained significantly decreased 40 min post-MiCT (p < 0.05). Additionally, LnRMSSD for REHiT was significantly lower than for MiCT immediately and after 20 min, 40 min, and 60 min (p < 0.05) (Figure 5).
Lnlf and LnHF showed significant reductions immediately and 20 and 40 min post-REHiT (p < 0.05). Moreover, LnLF significantly decreased immediately and at 20 and 40 min post-MiCT (p < 0.05). LnHF was only reduced immediately after MiCT (p < 0.05) (Table 3).
Table 3
Frequency domain heart rate variability indices following reduced-exertion high-intensity interval training and moderate-intensity continuous training (n = 16)
Rating of perceived exertion
The average RPE values after both exercise protocols are shown in Table 4. The RPE values increased significantly immediately after both exercise protocols (p < 0.05) (REHiT = 15.1 ± 2.0, corresponding to “hard”; MiCT = 13.0 ± 2.3, corresponding to “somewhat hard”). However, the RPE values for REHiT remained significantly increased from pre-exercise to 20 min after exercise.
Table 4
Rating of perceived exertion following reduced exertion, high-intensity training, and moderate-intensity continuous training (n = 16)
Discussion
This study aimed to explore cardiac autonomic recovery after REHiT and MiCT in physically inactive men. The time domain HRV indices, SDNN and RMSSD, decreased immediately after both exercise protocols. Following MiCT, SDNN and RMSSD returned to baseline within 20 and 40 min, respectively. in contrast, after REHiT, SDNN and RMSSD returned to baseline 24 h. Regarding frequency-domain HRV indices, LF returned to baseline 60 min after REHiT and MiCT. Additionally, HF returned to baseline within 40 min following MiCT and 60 min following REHiT.
The findings suggest that cardiac autonomic recovery may be slower after REHiT than MiCT. This aligns with previous studies demonstrating slow HRV recovery following HI IT [4, 9] and sprint interval training (SIT) [22]. Although the REHiT protocol involves short, high-intensity periods (two intervals of 20 s each), its intensity surpasses that of MiCT. The data from this study further support the association between higher exercise intensity and delayed HRV recovery [23, 24].
During exercise, HRV decreased in the time domain, as indicated by reduced SDNN (representing overall HRV) and RMSSD (reflecting cardiac parasympathetic activity). Changes were also observed in the frequency domain during exercise, with a decrease in LF and HF (associated with cardiac parasympathetic activity) [10]. These findings suggest parasympathetic withdrawal during exercise [25]. immediately after exercise cessation and during post-exercise recovery, HR and HRV recovered in a time-dependent manner, gradually returning to pre-exercise levels. This recovery was likely influenced by the gradual reactivation of the parasympathetic nervous system and the withdrawal of sympathetic activity [26].
Higher exercise intensity is associated with slower HRV recovery [27], specifically LnRMSSD or HF (cardiac parasympathetic neural activity-HRV parameters) [5]. HRV recovery might be influenced by other factors, such as exercise duration and modality [26]. Kaikkonen et al. [28] demonstrated that extending exercise duration by 300-400% may delay HRV recovery. Cunha et al. [29] suggested that an increased active muscle mass and/or higher energy expenditure is associated with a slower recovery of HRV. Taken together, it could be assumed that REHiT significantly impacts HRV recovery, with higher intensities leading to prolonged recovery of HRV parameters. Previous studies have implicated the accumulation of stress metabolites in skeletal muscle and blood [3032] and changes in plasma volume [33, 34] as possible mechanisms underlying this effect.
The average RPE following REHiT was approximately 15, corresponding to “hard”, higher than the RPE of 13, “somewhat hard”, reported by a previous study [14]. This difference may be due to our evaluation after a single REHiT session, whereas the previous study’s RPE was based on 18 sessions with familiarised participants. Furthermore, the RPE immediately after REHiT was higher than after MiCT, consistent with the positive relationship between RPE and exercise intensity [35].
Limitations
This study had some limitations. PA levels during the week between exercise sessions were recorded by participants using an activity log, introducing potential bias. However, all participants confirmed that they maintained their regular PA levels throughout the study period. The study included only healthy males, which may limit the application of these results to all populations. Additionally, our results pertain solely to cardiovascular system recovery, and the recovery of other physiological systems, such as neuromuscular and metabolic systems, needs consideration.
Conclusions
Both REHiT and MiCT led to a significant reduction in HRV immediately after exercise cessation in men with insufficient PA levels. However, HRV recovery was slower following REHiT. Nonetheless, HRV was fully restored 60 min after MiCT and 24 h after REHiT. These findings provide valuable insights into the prescription of the REHiT protocol, suggesting that while REHiT is effective, it requires a longer recovery period for cardiac autonomic function compared to MiCT.