Introduction
Cardiac Rehabilitation Programs (CRPs) are secondary and tertiary prevention strategies for recent cardiovascular events. CRPs are commonly developed in four phases, which can vary in location. Phase i is implemented during the hospital stage; phase ii occurs in outpatient locations, and phases iii and iV, also called the maintenance phases, usually occur outside hospital facilities [1, 2]. Evidence suggests that patients with coronary heart disease participating in CRPs can improve their physical fitness, physical activity (PA) levels, and quality of life (QoL). it has also been said that CRPs may reduce cardiovascular mortality by 20% [3–7].
Programs during phase ii are performed in a supervised environment, commonly with three components: First, an aerobic moderate-intensity continuous training, followed by muscular endurance training, and finally, an education session to control risk factors and give psychological support [3, 7]. Phase ii of these programs is generally performed thrice weekly for 12 weeks. However, in some European countries, phase ii is offered for 3 to 6 weeks [8]. Literature shows significant variation in the type, duration, frequency, intensity, and volume of exercise training; likewise, in many countries, standardized treatment guidelines have not been established [9–11]. Considering the above and that some studies suggest that there is still limited knowledge about the optimal dose of exercise that could lead to patients receiving a suboptimal benefit from this intervention [12–14], it is important to develop better evidence in the field.
Moreover, it is estimated that between 10% and 30% of the eligible population participates in phase ii of a CRP, and 50% of these subjects drop out prematurely. The long duration of the intervention can discourage service usage and, therefore, increase premature dropout from the program. A shorter rehabilitation program could decrease the problems mentioned before; however, evaluating its outcomes is necessary [8, 11, 15]. Therefore, this study aims to compare the effect of an 8-week treatment with a 12-week treatment on exercise capacity (EC), PA levels, and QoL in subjects undergoing percutaneous coronary intervention.
Subjects and methods
A double-blinded randomized controlled clinical trial with two parallel intervention groups was completed from February to december 2019.
Participants
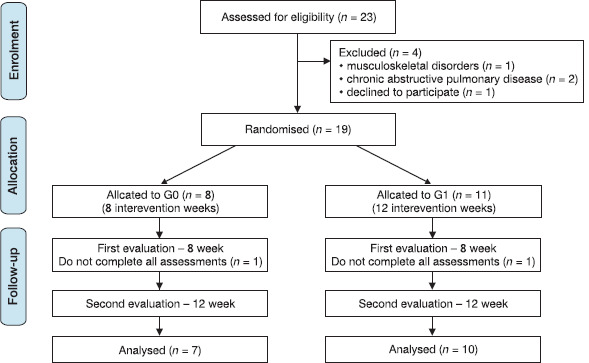
Participants consisted of adults (> 18 years) who underwent angioplasty for their first coronary event and were referred to a phase ii CRP in the outpatient clinic “Profesionales de la Salud y Cia LTd” in Bucaramanga, Colombia. Patients voluntarily agreed to participate in the trial by signing the informed consent. Participants with musculoskeletal disorders that prevented them from performing moderate-intensity exercises (n = 1) and those who had chronic obstructive pulmonary disease (CoPd) as a comorbidity (n = 2) were excluded. Additionally, there were two (n = 6) dropouts from the program. Twenty-three subjects were randomly allocated into two intervention groups, G0: 8-week program or G: 12-week program. Using sealed opaque envelopes for randomization, created by an uninvolved individual, sequentially numbered, and opened by a different person from the creator and assessor. Finally, it is important to mention that no adverse events were presented (see Figure 1).
Procedures
Measurements
A baseline evaluation collected sociodemographic and clinical information from each patient. Subsequently, a six-minute walk test (6 MWT) to predict the maximal oxygen consumption (Vo2 max), using the distance covered with the following equation Vo2 max (ml/kg/min) = 4.948 + 0.023 • mean 6 MWd (meters) [16]. The 6 MWT was performed according to the ATS guidelines in a 30-meter hallway. First, patients rested 10 min before the test; after, the baseline heart rate (HR), blood pressure (BP), Spo2, and dyspnea status parameters were recorded at the beginning and end of the test. The test was discontinued if chest pain, severe dyspnea, or spasms of the lower extremity muscles occurred or if the patient wanted to quit. The patients were observed for 15 min after the test for any adverse events [17].
Additionally, participants filled out two questionnaires: (1) The international Physical Activity Questionnaire (iPAQ-short form) to assess PA levels and sedentary behaviours over the past seven days. The iPAQ short form inquires about three specific types of activities conducted in the three domains (walking, moderate-intensity activities, and vigorous-intensity activities), as well as sitting within the last 7 days. Frequency (measured in days per week) and duration (times per day) are collected separately for each specific type of activity.
There is also a question about the time individuals spend sitting [18]. Participants were classified based on whether they met the global PA recommendations, which consist of either 150 min of moderate PA or 75 min of vigorous PA per week [19]. (2) The SF-36 to evaluate QoL [20]. The Colombian-validated version of the SF-36 was used. The SF-36 is comprised of 36 items distributed across eight dimensions: physical function (10 items), physical role (4 items), body pain (2 items), general health (5 items), vitality (4 items), social function (2 items), emotional role (3 items), and mental health (5 items). To calculate the scores, the items within each dimension were coded, aggregated, and transformed into a scale that ranges from 0 (representing the worst state of health for that dimension) to 100 (representing the best state of health-related QoL). Evaluations were conducted by a physical therapist who was different from the intervention therapists on three occasions: before the intervention, at week 8, and at week 12 for both intervention groups.
Intervention
Intervention for both groups consisted of three weekly sessions over the course of 8 and 12 weeks, respectively. Each session lasted 60 min and included a 5-minute warm-up, 40 min of aerobic exercise on a treadmill or cycle ergometer at an intensity of 50% to 70% of their maximum HR (HR max), and a perceived exertion level of 3 to 5 on the modified Borg scale, followed by a 5-minute cooldown phase. in addition, the program incorporated two weekly sessions of muscular resistance exercises. These sessions involved full-body resistance training using elastic bands at moderate intensity (3–5 on the modified Borg scale), with three sets of 10 repetitions targeting major muscle groups: shoulder abduction, shoulder flexion, biceps curls, triceps extensions, seated rows, squats, seated leg extensions, seated leg curls, hip abduction, and seated calf raises. The resistance of the bands was progressively increased to advance the training volume [1, 15].
Both interventions were conducted by two physiotherapists specializing in cardiac rehabilitation. Exercise monitoring was conducted using a pulse oximeter and the modified Borg scale, both 10 min after the start of training and at the end of the exercise session. Upon completing the 8-week program, participants were encouraged to continue engaging in PA 3–5 times per week, aiming to achieve at least 150– 300 min of moderate-intensity aerobic PA per week, in accordance with the World Health organization’s (WHo) PA recommendations [19].
Statistical analysis
Data are presented as means ± SD and medians (25th percentile and 75th percentile) or counts and percentages. A comparison of demographic and clinical characteristics between groups at baseline was performed using a Fisher’s exact test. Given the small sample size, non-parametric statistics were used for hypothesis testing. Comparison of EC indices, sedentary time, and QoL scores between groups at each time-point were made using the Unpaired Two-Samples Wilcoxon Test. The effect of time in each group was evaluated using the Friedman test. When there was a significant Friedman test, post hoc pairwise Wilcoxon signed-rank tests with BenjaminiHochberg corrections were applied. A one-Way Repeated Measures Analysis of Variance (ANoVA) method was also applied. Finally, post hoc comparisons were performed using the Tukey test when appropriate.
As part of the non-parametric variance analysis (ATS), the relative treatment effects (RTEs) were calculated and presented in graphs. An RTE was defined as the probability of the participants in one group having larger (higher or lower) scores compared with the scores of all participants under study. The RTEs range between 0 and 1. if the null hypotheses of no group, time, or interaction effects are not rejected, all groups should have an RTE of 0.50. Multivariable Generalized Estimating Equations (GEE) models with a binomial distribution, an unstructured covariance structure, and log as the link function were applied to determine the effects of group, time, and the interaction between group and time on meeting PA guideline variables (yes/no). All analyses were performed in R 4.0.1 for Mac (RStudio: integrated development for R. RStudio, inc., Boston, MA, USA). The “nparLd” [21], “rstatix” [22], and “geepack” [23] libraries were used. A level of significance of 0.05 for all analyses was applied.
Results
At baseline assessment, the two groups’ demographic and clinical characteristics were compared (Table 1).
Table 1
Baseline demographic and clinical characteristics of individuals
Effects of the training group on exercise capacity indices and sedentary time
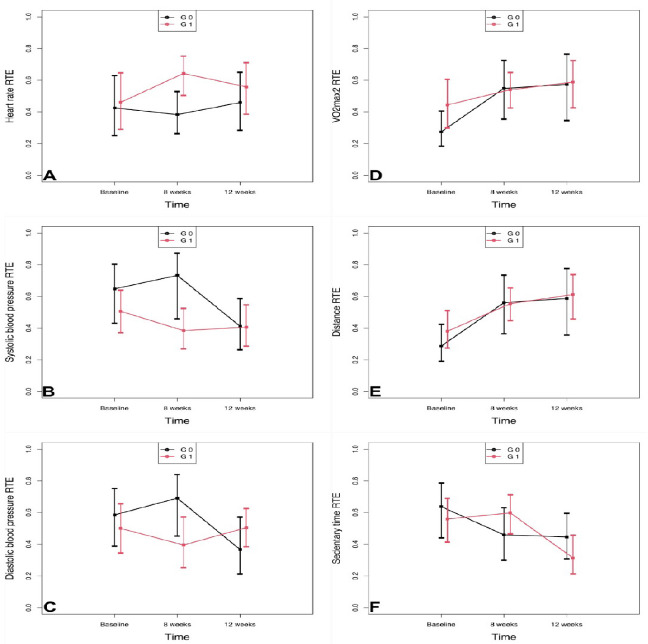
The descriptive statistics and the results from the non-parametric analysis of EC indices and sedentary time are presented in Table 2. ATS showed no significant interaction or group effects. However, at eight weeks, the systolic BP was higher in the 8-week group than in the 12-week group [Median (P25, P75): G0 = 142 (122, 150), vs. G1 = 116.5 (109, 119); p = 0.045]. The rise of Vo2 max was only significant in the 8-week group (Friedman test: p = 0.018; ANoVA: p = 0,006); there was a significant increase at 8 weeks and 12 weeks compared to baseline. distance increased significantly over time in both groups. in addition, there was a significant decrease in sedentary behaviour at 12 weeks compared to baseline in the 8-week treatment group and compared to week eight in the 12-week treatment group. Moreover, the RTEs were not significantly different at any time point (Figure 2).
Table 2
Effects of the training group on exercise capacity indices and sedentary time at 8 weeks and 12 weeks.
Effects of the training group on health-related quality of life
ANoVA showed significant effects on physical functioning in the 12-week group. Physical and emotional role scores improved significantly from baseline through week eight and social functioning through week twelve in the 8-week treatment group (Table 3). There was a significant difference (95% Ci did not overlap) between the groups regarding TEN at baseline in the physical and emotional role. Furthermore, the RTEs increased in physical and emotional roles from baseline to 8 weeks (Figure 3).
Figure 3
Relative treatment effect (RTE) by group over time: (A) physical functioning (B) role physical (C) bodily pain (d) general health (E) vitality (F) social functioning (G) role emotional, (H) mental health G0: 8 weeks of cardiac rehabilitation G1: 12 weeks of cardiac rehabilitation
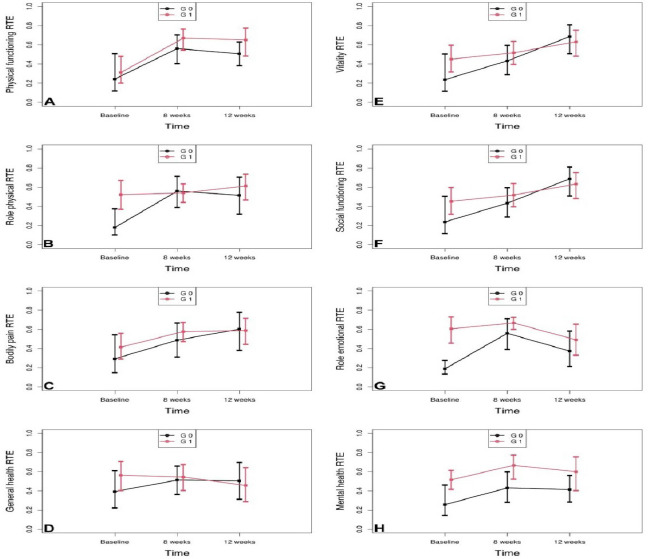
Table 3
Effects of the training group on quality of life at 8 weeks and 12 weeks.
Effects of the training group on meeting PA recommendations
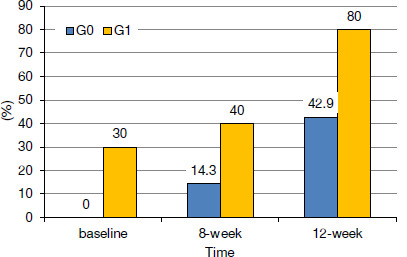
The GEE analyses show no significant effect of the interaction between the groups and time (Table 4). in a multivariable model without the interaction term, the percentage of patients meeting PA guidelines increased at 12 weeks compared to baseline (Table 4, Figure 4). in addition, the percentage of patients meeting PA guidelines was greater in the 12-week group (Figure 4).
Table 4
Effects of the training group on meeting physical activity guidelines. Generalized Estimated Equations Models
Discussion
The eight-week CRP showed improvements in EC, QoL, levels of PA, and sedentary behaviours. Additionally, there is a cumulative effect in levels of PA and sedentary behaviours after 12 weeks of rehabilitation. davos et al. [10] pointed out the need to achieve at least 1000 units to obtain successful results by multiplying the number of weeks of exercise by the average number of sessions/week and the average duration of the sessions in minutes. This is a requirement that was taken into account in the planning of the two types of treatments used in the study. The improvements in Vo2 max and distance walked after eight weeks of treatment in both groups of this study concur with those reported in previous studies [24]. Andjic et al. [25] found changes in EC after the third week of intervention in those under 65 years of age (p < 0.001). Bellet et al. [26] demonstrated differences in the distance covered in the 6 MWT for a group of patients with a history of cardiovascular disease engaged in one and two sessions of aerobic physical exercise per week. Additionally, Hannan et al. [27] identified that an exercise program lasting more than seven weeks produces positive changes in cardiorespiratory fitness. However, they report that this result does not appear to improve significantly after an 8-week workout. The preceding leads us to conclude that the effects of exercise in these types of patients may occur earlier, mainly due to morphophysiological adaptations such as the improvement in the mitochondrial myoglobin ratio. This phenomenon is related to the increase in lean mass and muscle fibres dependent on aerobic metabolism [28]. other factors that could explain the attenuation in the improvement of Vo2 max after the eighth week of treatment are the intensity and the exercise modality that is commonly prescribed after this period. despite several studies showing that vigorous exercise and interval intensity can increase EC to a greater extent [29–32], the intensity of the exercise during this study was moderate. Likewise, clinical characteristics such as the number of compromised vessels and the type of infarction can determine changes in Vo2 after CRPs [33, 34].
Another point to discuss is the minimum clinically important difference (MCid) of 25 m, evidenced in studies done in subjects with coronary artery disease who are undergoing the 6 MWT [35, 36]. The MCid is defined as the smallest clinical change that is important to the patient [37]. Considering the above, it is confirmed that in the present study, the clinically important results are presented at the end of the eighth week of treatment.
There appear to be no studies comparing the effects in QoL of an 8-week and a 12-week program. However, there is evidence that CRPs focused on exercise positively affect the different domains of QoL in people with coronary heart disease. Sadeghi et al. [38] compared an intervention of 12 vs. 24 weeks, performing a weekly exercise session and education, finding changes in the total QoL in both study groups, but without differences between groups. Chen et al. [39] compared an exercise group vs conventional medical treatment through a program of 36 sessions over 12 weeks, finding changes in the domains of physical function and general health. on the other hand, Saeidi et al. [40] carried out a quasi-experimental study that included 24 sessions, three days per week, during eight weeks of exercise and education directed by an interdisciplinary team. They reported changes in physical function, physical role, pain body, general health, and vitality. A similar study carried out by Masoumi et al. [41] using 40 sessions over 13 weeks found significant changes in all domains after the intervention, concluding that improving the physical state of patients influences their psychological condition, decreases work disability, helps to regain participation in social activities, and improves well-being. These findings indicate that performing a CRP favours QoL, and its improvement may be directly related to the number of sessions completed. it is crucial to note that the effectiveness of the rehabilitation protocols employed in this study may have been diminished by the sole focus on physical exercise, neglecting psychological interventions, which are essential for enhancing the QoL in this population [42, 43].
At baseline in our study, no participants in the 8-week group met the PA recommendations, and only 30% in the 12-week group met them. However, at the 8 and 12-week follow-up, there was an increase in the percentage of participants meeting PA recommendations in both groups, but significantly greater in the 12-week group. These results could be explained by adherence. Ramadi et al. [44] showed that participants included in 12-week CRPs spent more time practising PA, and most of them met the PA recommendations. Additionally, Sadeghi et al. [38] mentioned that long-term 24-week CRPs have been associated with better results compared to short-term programs performed for 12 weeks, given the cumulative effect of the benefits of PA. instead, sedentary behaviour and physical inactivity are considered independent risk factors for all causes of death. CRPs focus mainly on achieving weekly levels of PA, not being successful in most cases in attenuating sedentary behaviours, even though it has been reported that with each hour of sedentary lifestyle beyond the 7 hours/day, there is a 5% increase in mortality and that there is a negative relationship between the number of interruptions in sedentary time and the number of cardiometabolic risk factors [45–47]. Therefore, the results of the present investigation are relevant, considering that a decrease in this behaviour was evidenced in week 12 for the two intervention groups.
The study by Alsaleh et al. [48] consisted of a behavioural intervention based on Social Cognitive and Self-efficacy theories in patients with coronary artery disease and adopted behaviour change strategies (goal setting, self-control, and feedback). These studies had high recruitment rates and low attrition rates and received positive feedback. Likewise, there was an accessible intervention to increase PA levels in patients with coronary artery disease. Those findings were similar to what was found in our study, even though such counselling and telephone follow-up needed to be carried out in a structured way. in fact, in our study, counselling was done informally, and general recommendations for healthy lifestyle habits were made. in agreement with Alsaleh et al. [48], our findings are limited by the subjective measurements of PA levels, given the characteristics of being self-reported. Although the iPAQ is a valid and reliable measure of PA, self-reporting can give a distorted impression of PA levels (usually an overestimation) compared to objective measures of PA [49]. However, it should also be noted that the application of the questionnaire was standardized to minimize conjecture and overestimation or underestimation of PA levels, which can occur when patients complete the questionnaires on their own [50]. one of the possible explanations for a lower increase in the proportion of participants who meet the PA recommendations in the 12-week group may be because participants in this group at baseline already were performing some type of PA, which is why they would tend to improve to a lesser extent since they were in better physical condition before the start of the CRP. Similar findings were also reported in Branco et al. [51] study, which evaluated an intervention like ours for 8 and 12 weeks.
Limitations and recommendations
The small sample size of the study could affect the results of the study, influenced by appropriate patient recruitment due to social isolation because of the CoVid-19 pandemic. Also, due to data limitations, we were unable to examine several factors that have been associated with adherence in other published studies; these factors included copayment, income, self-motivation, and work demands.
Conclusions
The CRP evaluated in this study shows improvement in EC, QoL, levels of PA, and sedentary behaviour after eight weeks of treatment. Additionally, there is a cumulative effect on the results of the levels of PA and sedentary behaviour until 12 weeks of rehabilitation without the presence of adverse events. The implication for clinical practice is that the exercise traditionally used in cardiac rehabilitation shows early changes without significant improvement after 12 weeks of training.