Introduction
Globally, india has the highest prevalence of type 2 diabetes, causing a substantial burden on the patient due to its microvascular and macrovascular complications like peripheral neuropathy, retinopathy, nephropathy, and ulcers. Diabetes and its complications will lead to an expenditure of 4.8 billion dollars (US) by 2030. The prevalence of diabetic peripheral neuropathy (DPN) ranges from 8% to 59% [1]. Pain as a direct consequence of peripheral nerve abnormalities and various sensory systems in people with diabetes is termed painful diabetic neuropathy (PDN) [2]. PDN occurs as a complication in 88% of all patients with DPN [3].
Pain with a burning quality is seen predominantly in the feet [4]. The intensity of pain has a direct impact on function [5], levels of anxiety, kinesiophobia, fear of pain, and fear of hypoglycaemia [6] in PDN. it leads to reduced levels of physical activity (PA), causing a reduced range of motion at the ankle and decreased strength in the dorsiflexors and plantar flexors [7].
These psychological and motor factors lead to a decline in the social and daily activities of patients with PDN. As a result, the dependency levels on others increase, leading to depression and a reduction in the physical domain of quality of life (QoL) [8].
Treatment for PDN is still under consideration as the pathogenesis of the pain process is complex [9]. Even though there is high compliance with drug prescriptions in PDN, 90% of patients need two or more medications, with only a 27% satisfaction rate after pharmacological intervention [10]. This warrants more studies exploring non-pharmacological treatment for better outcomes in patients with PDN.
Physiotherapists have focused on the kinesiography modality for the treatment of pain in DPN. Exercise-based interventions have helped to improve balance confidence, thus improving the function and body pain component [7]. Psychosocial components have not been studied in exercise- based interventions. Graded motor imagery (GMi) targets the psychological and motor components as it is a cognitive- based therapy. it helps to reorganise and activate the cortical motor networks, thus helping to reduce pain and improve function [11]. Kinesiophobia in PDN induces decreased recruitment of the dorsiflexors and plantar flexors of the ankle joint. This eventually causes weakening and atrophy in these muscles. Along with reduced use, the presence of discomfort causes decreased weight bearing and unequal weight distribution in the lower limbs, further reducing the patient’s mobility and QoL.
Effects of GMi have been explored in various conditions like complex regional pain syndrome and phantom limb pain, but no studies were available where the effects of GMi on PDN have been studied. As a result, it is critical to carry out the current study to establish the effect of GMi on QoL, intensity of pain, and catastrophisation of pain in PDN.
Objective of the study
To determine the effect of GMi on QoL, intensity of pain, and catastrophisation of pain in PDN. Subjects and methods
Study setting
Participants were recruited after receiving approval from the institutional Ethics Committee. This study was a pilot study. it was designed according to SPIRIT guidelines. The trial was registered at ctri.gov.in (CTRI/2022/01/039276). Convenience sampling was used.
Sample size calculation
Pilot studies are not confirmatory trials, hence they should not be hypothesis-driven (for example, p-value-centric). A pilot study’s analysis should focus on descriptive statistics (e.g., means, SDs, and quantiles for continuous variables; frequencies and percentages for categorical variables) and precision estimates (i.e., width of Ci). A formal statistical power estimate is unnecessary for pilot investigations because they are not hypothesis-driven.
As per convenience sampling, 20 participants were included.
Eligibility criteria
A physical therapist screened the eligibility of potential participants: participants of all sexes aged between 18-75 years diagnosed with either type of diabetes with a confirmed diagnosis of PDN based on DN-4 criteria (score of > 3) visiting the OPD at Goa Medical College and Hospital between August 2021 - August 2022 and those willing to sign the consent form were included.
The exclusion criteria were participants presenting with severe OA, knee/ankle ligament sprains, fractures of the lower limb, non-specific low back pain (NSLBP), lumbar disc prolapse (LDP), other neurological diseases than PDN, other diseases causing pain in the feet (e.g. ulcers, amputation, vascular insufficiency), presence of severe cardiovascular and respiratory diseases, and participants on chemotherapeutic drugs or radiation in the last 10 years.
Outcome measures
Visual Analogue Scale (VAS) - This scale is used to assess the intensity of pain with a marking of 10 cms where 0 indicates no pain, and 10 indicates maximum pain. The subject marks on the line and the amount of pain is recorded. The score is measured using a ruler by the therapist. The VAS is a valid and reliable scale [12].
Pain Catastrophization Scale (PCS) - The PCS is a 13- item instrument having 3 sub-scale scores that assess rumination, magnification, and helplessness. it takes about 5 min to complete the scale. Subject’s thoughts or feelings when experiencing pain, on a 5-point scale with the endpoints 0-4 (not at all-all the time). Total PCS has an internal consistency of 0.87 [13, 14].
Sf-36 (RAND) - SF-36 has 36 questions that cover 8 domains of health: physical function, role limitation due to physical health, role limitation due to emotional problems, energy/ fatigue, emotional well-being, pain, social functioning, general health score, and health changes. it has an internal consistency of 0.79 (alpha range 0.70-0.90). A moderate degree of convergent validity was also seen (alpha 0.68) in patients with neuropathic pain [15].
Method of data collection
After obtaining clearance from the institutional Ethics Committee, participants of all sexes aged between 18-75 years diagnosed with either type of diabetes in the lower limbs were screened for PDN using the DN-4 Questionnaire. Only those presenting with a score of 3 or more were diagnosed as having PDN and included after fulfilling the inclusion and exclusion criteria. The willing participants were explained about the need for the study and then written informed consent was taken. Baseline characteristics of age, sex, body mass index (BMi), smoking history, alcohol consumption, PA level, duration of diabetes, HbA1c levels, medical treatment (drug or insulin), and duration of neuropathic pain complaints were recorded. Outcome measures like QoL, intensity of pain, and catastrophisation of pain were recorded at baseline. Participants received 8 weeks of GMi therapy. Assessment of QoL, the intensity of pain, and catastrophisation of pain was done at baseline, at the 8th week post-intervention, and follow-up at 12 weeks.
intervention
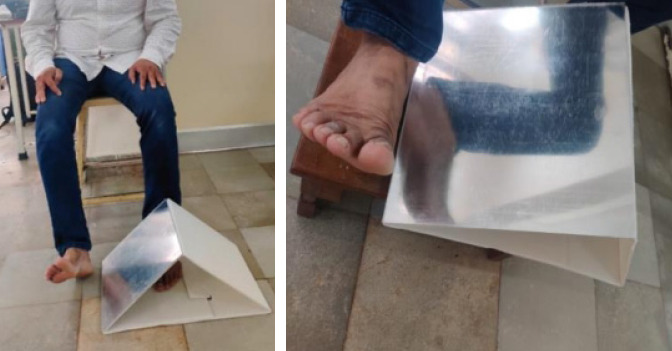
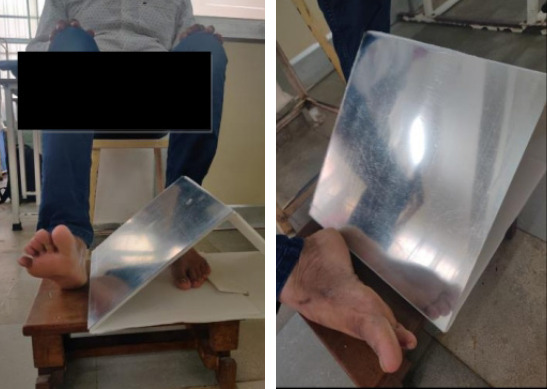
The GMi programme was dedicated to developing left/ right judging skills for 2 weeks. The Neuro Orthopaedic institute (NOi) Recognise TM software tool was utilised. To reduce interruptions, the app’s interface was kept at “vanilla”, which displayed pictures on a simple frame. Fifty pictures of the lower limb, specifically the ankle joint, depicting both the ailing and unaffected joint, were shown in various orientations and alignments. Each picture was shown for 5 s, and the subject had to indicate whether the depicted joint was left or right. The Recognise TM programme tracked each trial’s reaction time and accuracy. Participants in the home exercise regimen were given various magazines with images of outsiders. They were taught to identify and mark the joints that they thought were matching their affected side. Subjects were instructed to complete these tasks for 10 min per waking hour. The following 2 weeks were spent imagining moves. Participants were presented with a photograph of a joint from the app that matched the side of their impaired joint. The patients were told to visualise slowly and smoothly returning their injured joint to its initial posture after imagining it had moved from where it felt to be, to the posture depicted in the picture. it was made clear to participants that they should visualise themselves doing the exercise rather than picturing someone else doing it. For every 30-minute treatment session, three images were used to repeatedly perform imagined movements. Participants in the home exercise program received three printed photos or three images on their smartphones, and they were instructed to follow the treatment session instructions for 10 min each waking hour. The mirror movement phase lasted for the next 2 weeks. The mirror box used was specially made by a company based in Adelaide, Australia. Subjects were given instructions to simultaneously move the affected and unaffected joint into the displayed posture while watching the intact joint’s reflection in the mirror (Figures 1 and 2). They were also shown a photograph of the unaffected joint in an easily attained position. For every 30-minute treatment session, three images were used to repeat mirror therapy activities. To complete the home exercise program, subjects were instructed to follow the treatment session’s instructions for 10 min each waking hour. The previous week’s activities were repeated in the last 2 weeks. Adherence to the home exercise program was tracked by using an adherence diary and telephonic calls.
Data management
All data were entered into computer software (Excel TM Microsoftware, 2017) and checked twice weekly by the other researchers, using standard coding to ensure the confidentiality of the participants.
Statistical analysis
Statistical analysis was done for 20 participants. Two participants did not report for follow-up. Frequency and percentages were used for the presentation of demographic variables. Normality of distribution was found by using the Kolmogorov- Smirnov test. The change in scores of different parameters from pre-test to follow-up did not follow normal distribution. Therefore, the non-parametric tests were applied. Friedman’s test was used for comparing various time points, Wilcoxon matched pair statistical test was used for the comparison of pairs of time points. The level of significance was set at 5% (p < 0.05) with a confidence interval level of 95%.
Results
Demographic characteristics
When the demographic details were compared, age, sex, BMi, literacy level, alcohol consumption, duration of diabetes, pain levels, HBA1C level, and PA, the p-value was > 0.05, indicating homogeneity using Tables 1 and 2.
Table 1
Baseline demographic characteristics.
Table 2
Qol, severity of pain, and catastrophisation of pain scores at various time points.
Outcome measures
Rand SF-36 - statistically significant results were seen in the physical function, energy/fatigue, pain/general health, and health change components with a p-value < 0.05 (Table 2).
Vas - assessing pain showed a statistically significant difference with a p-value < 0.0012 (Table 2).
Pcs - showed a statistically significant difference with a p-value < 0.0001(Table 2).
Discussion
In the present study, the experimental group received GMI, which includes lateralisation, movement imagination, and mirror therapy. Improvements were seen in all the components of RAND SF-36 except for two emotional components and general health. The advantage of using the RAND SF-36 is that it allows the assessment of physical and mental domains as 8 separated components and evaluated on a scale of 0 (worst QoL) - 100 (best QoL). Changes were also noted in VAS and PCS. GMI targets the psychological and the motor components. It helps to reorganise and activate the cortical motor networks, thus helping to reduce pain and improve function [8]. Similar results were also noted in the present study where there was a reduction in intensity of pain on the VAS as well as the pain component of RAND SF-36. Using the principles of graded exposure to GMI, patients with PDN exposed to fear-provoking activities [9] show greater improvement in QoL and increased levels of PA by reducing the perceived harmfulness of the activities [10].
Davoudi et al. [14] found that GMI helped lower pain and improve movement in neuropathic pain and CRPS patients. This was attributable to an increased somatosensory hand size representation. GMI is a treatment technique for a hypersensitive nervous system that involves gradually stimulating separate neural chains. GMI has been shown to reduce pain and sensory disturbances while increasing function and mobility in cases of potential central sensitisation [12]. GMI is a type of imaging that aids in the creation of multidimensional sensory-rich images that closely resemble the actual perception of an object, scene, or event in the absence of external inputs. It has been described as the interaction of body and mind causing physical, emotional, or spiritual dimensional changes using the power of imagination. They are “guided” with music and explanations in a calm environment to create awareness of their senses and their disturbances [13]. Exercises were structured and progressed in complexity which may have helped the participants to reduce fear and avoidance behaviours associated with kinesiophobia. The reduction in pain could have been due to the release of endorphins associated with exercise, thus correcting the catastrophisa- tion of the pain component. As the strength improved with graded exercises, participants were more confident in their ability to move. This self-directed strategy may have boosted motivation, self-efficacy, and overall participation in the recovery process [16-18].
Efficacy, safety and feasibility studies on exercise therapy in diabetes-related pain have been studied in animal models, but rarely any studies on humans have been done [19]. Additional research is needed to develop standardised protocols for evaluating motor imagery, identify particular patient groups that would benefit the most from GMI therapy, and investigate the long-term impact [20].
Conclusions
Eight weeks of GMI improved the intensity of pain, cata- strophisation of pain, and QoL in PDN.
Limitations
Participants faced difficulty in understanding the significance of the catastrophisation of pain.
Due to a lack of information and awareness about recent advances such as GMI, participants had certain reservations about the efficacy of this particular intervention.
Motor imagery levels were not assessed for any participants.