
Introduction
According to Bruscia, music therapy is a reflexive process wherein a credentialed music therapist helps a patient to optimise their health, using music experiences and the relationships formed through them as impetus for change [1]. In contrast, music listening is defined as an individual listening to carefully selected music as the agent of change, without the presence of a certified music therapist [2].
Music listening is a well-liked activity across societies, bringing forth emotional experiences in various contexts [3]. Varying factors of music, such as major/minor chords, tempo, rhythmic structure, and frequency, can influence the listen-er’s physiological and emotional responses [4]. For example, a slower tempo and lower sounds have been shown to decrease one’s heart rate while lessening stress levels, and vice versa [5, 6]. A meta-analysis of 102 physiological studies also supports the anxiolytic effects of music listening, which can be correlated with modifying the nervous system’s response to stimuli [7].
The effect of music on the autonomic nervous system (ANS) describes a statistically significant positive change in lowering blood pressure, heart rate, and electrodermal activity within an individual [8]. Furthermore, given that the ANS is both associated with physiological health and is responsive to music, the ANS may serve as a pathway by which music exerts its therapeutic effect [8]. This effect has been studied throughout numerous patient populations and age groups [9]; however, to date, there remains a gap in the literature on the effects of music listening in patients who are in an intensive care unit (ICU).
Patients admitted to the ICU are critically ill and often experience increased anxiety and pain [10–12]. In turn, the physiological response of the sympathetic nervous system leads to an increase in cardiac workload that is associated with hypertension and tachycardia [13, 14]. The effects of both increased blood pressure and heart rate are of particular importance when considering those who may already have compromised cardiac status [14]. Consequently, controlling anxiety and pain, along with maintaining safe vitals, is of utmost importance for both the patient and clinician in the ICU setting.
Critically ill patients in the ICU may experience moderate to severe pain from various causes, including surgery, trauma, immobilisation, invasive procedures, and therapeutic devices such as catheters, drains, endotracheal tubes, and chest tubes [10–12, 15–18]. Increased pain levels are relevant to critical care as they correlate with an increase in blood pressure and heart rate [19, 20].
Opioid therapy remains the mainstay of medical management of pain for patients in critical care settings [21]. However, pharmacologic agents for pain are not without side effects and can lead to unwanted issues such as opioid tolerance, withdrawal, and delirium [22, 23]. As an alternative to pharmacologic options, listening to music offers another option to reduce discomfort. Music directly influences the brain by prompting the release of endorphins, which function as a natural morphine substitute [24]. In turn, the patient experiences a decrease in pain, which then decreases both the heart rate and blood pressure [24–27]. Subsequently, medical status and well-being may be positively impacted for those who are critically ill.
Besides pain, patients receiving critical care may also experience a considerable amount of anxiety, as ICU environments are comparatively stressful [28]. As a result of extensive life-saving procedures, critically ill patients often experience many anxiogenic factors, including invasive treatments, inability to communicate, reduced personal dignity, insufficient sleep, loss of interaction with family, and the threat of death [28]. In turn, these events increase anxiety, which then activates the sympathetic nervous system and manifests as elevated heart rate and blood pressure.
Overall, it is important to monitor vitals and anxiogenic responses closely to ensure safety, particularly during medical and therapeutic procedures [29]. In addition to standard medical management, a noninvasive approach such as music listening may assist clinicians by mitigating the negative physiological effects of hypertension and tachycardia. Numerous reports have demonstrated the effect of music listening on stress reduction and lowered vital signs in different contexts; however, not within an ICU setting. Hence, the question arises whether such manipulation would yield similar effects in individuals in the ICU setting.
Subjects and methods
Data sources and literature search strategy
A systematic literature search was conducted from September 2019 to August 2020, including articles published until the end of August 2020 in the following databases: CINAHL, Cochrane Library, ProQuest, and PubMed. The search strategy was developed using the PICO framework (Population, Intervention, Comparison, Outcome), which was applied to each database with minor adaptations. An exploratory search using various combinations of keywords was conducted initially in each database to identify the most appropriate search terms according to the research question. The final search was based on the following strategy: (“Intensive Care Unit” OR ICU OR “Critical Care Unit” OR CCU) AND (Music OR “Music Therapy” OR Song*) AND (Vitals OR “Vital Signs” OR “Blood Pressure” OR BP OR “Heart Rate” OR HR OR physiolog*) NOT (Infant* OR Child* OR “Neonatal Intensive Care Unit” OR NICU OR Pediatric*). In addition, snowball searching was conducted of reference lists to identify further relevant articles. It should be noted that an additional search was conducted to find articles suitable for this topic dated from August 2020 to February 2026. Three additional articles were discovered using the search terms; however, none of these three met the inclusion criteria as later discussed. As a result, no additional articles were found that fit the selection criteria for this specific systematic review topic.
Eligibility criteria
After duplicates were removed, four reviewers independently screened the identified studies. For inclusion, studies had to be randomised controlled trials (RCTs) published in the English language. The authors chose to include only RCTs, as they are true experimental studies in which subjects are randomly assigned. RCTs are the gold standard as they offer the best answer on the efficacy of a treatment or intervention [30]. Eligible studies included samples of adults (18 years and over) admitted to the ICU and receiving an intervention that included playing music (any genre) compared with usual care. In addition, the authors did not distinguish between music therapy studies and music listening studies; however, all the studies that met the selection criteria used music listening as an intervention. Primary outcomes included HR and/or BP. Studies that did not fit the selection criteria were excluded from this systematic review.
Quality assessment
Assessment of methodological quality for all eligible studies was performed with the Physiotherapy Evidence Database (PEDro) scale [31]. The scale contains 11 items to assess risk of bias, with one criterion (item 1) addressing external validity. This criterion is not included in the calculation of the total score; therefore, a maximum of 10 points could be achieved. A point was allocated to a criterion (yes) if it was clearly satisfied; otherwise, the item was rated as not fulfilled (no). The PEDro score has demonstrated ‘fair’ to ‘excellent’ inter-rater reliability (intraclass correlation coefficient 0.53–0.91) for RCTs of physical therapy interventions, and the individual PEDro scale items range from ‘fair’ to ‘almost perfect’ (Kappa 0.36– 1.00) for physical therapy trials [32]. Convergent validity is supported for the total PEDro score through correlations with other quality rating tools such as the Jadad scale (r = 0.35) and the van Tulder (2003) scale (r = 0.71) for trials of physical therapy interventions [33, 34]. Two reviewers independently assessed the methodological quality rating for each article. Disagreements in ratings were discussed until consensus was reached.
Statistical analysis
The main characteristics of each included study were extracted, including information about the sample (initial sample size, age, and dropout rate), intervention (experimental and control), and primary outcomes (assessment and follow-up). Only data assessed immediately after the intervention period were extracted; data from longer follow-up periods were not considered because of the wide range of post-test intervals.
To investigate the overall effect of music intervention on HR and BP for participants in the ICU, the primary analysis compared groups who listened to music (including any genre of music) versus those receiving usual care. Subgroup analyses of the primary comparison were conducted. Subgroups were built according to the primary outcomes, as none of the studies included the measurement of both HR and BP. Additional subgroups were identified based on commonly used secondary outcomes that were reported across multiple studies.
All outcome variables used for analysis were continuous data and entered in an Excel spreadsheet as mean values with standard deviations. Mean differences (MD) were calculated for specified outcomes in the same unit of measurement (i.e., BPM, mm Hg) to yield a summary estimate with 95% confidence intervals (CIs). The differences between the pretest and posttest means were calculated for all primary outcomes of the music intervention groups. Absolute mean values were adjusted by multiplication with −1 to indicate improvements by decrease (i.e., HR, BP).
Results
Study selection
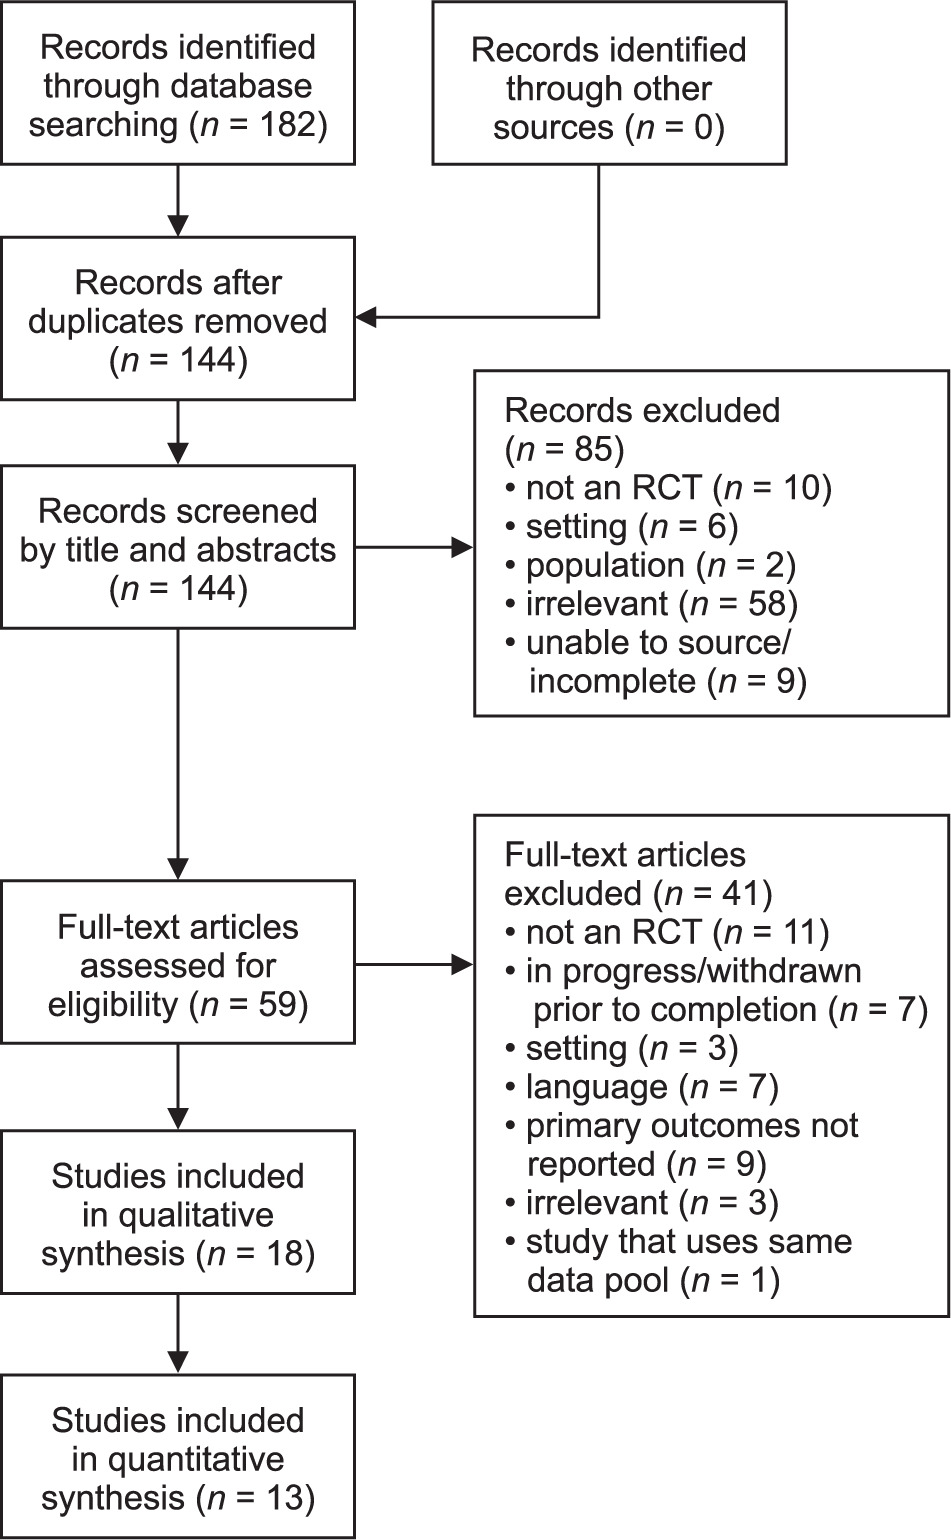
A total of 182 articles were screened for eligibility. Following detailed appraisals and the selection process (Figure 1), 18 RCTs met the selection criteria as eligible for this systematic review. All included trials were published between 1988 and 2019. All 18 studies that met the selection criteria utilised music listening as an intervention and not music therapy. After the systematic review with meta-analysis was completed in February 2026, three additional articles were identified through other sources. However, these three additional articles were not included in the systematic review with meta-analysis as two were protocols in which an intervention on vital signs was not included in the study, and the third article did not provide raw data, as vitals were a secondary outcome, instead only reporting change scores (Figure 1).
A summary of the main characteristics of each study is presented in Table 1. The sample sizes ranged from 20 to 160 participants (1295 total) and the mean age varied between 45.3 years and 71.9 years. The admitting diagnoses varied widely across studies and included (but were not limited to) conditions such as acute coronary syndrome, coronary artery disease, unstable angina, chronic kidney failure, liver failure, pancreatitis, and status post-surgery and trauma that required critical care in the ICU. A large variability existed in the music intervention protocols of the included studies. In general, these interventions included the use of headphones to play music described as soothing or relaxing, with some studies allowing patients to select the songs. Music was administered for one to three consecutive days (10–240 min/session; average = 48 min). Primary outcomes included HR and BP [systolic (SBP) and diastolic (DBP)], which were continuously monitored in the ICU setting (see Table 1).
Table 1
Characteristics of included music intervention studies (n = 18) with patients in the ICU (n =1295)
| Citation | Initial sample size | Mean age (years) | Protocol by group | Dosagev by group | Primary outcomes: baseline/pre-test | Primary outcomes: post-test | Mean change | PEDro Score |
|---|---|---|---|---|---|---|---|---|
| Zimmerman et al. [14] | 75 | 65 | Music group (n= 25): Patients were provided with a choice of music or Halpern relaxation tape Synthetic silence group (n= 25): Patients listened to white noise Control group (n= 25): No music or white noise | 1 session, 30-minutes in length | music group averages (SD): SBP (mm Hg) = 121.8 (22.0) DBP (mm Hg) = 70.5 (12.7) HR (BPM) = 81.7 (18.0) synthetic silence group averages (SD): SBP (mm Hg) = 122.9 (18.1) DBP (mm Hg) = 69.3 (8.7) HR (BPM) = 79.5 (22.8) control group averages (SD): SBP (mm Hg) = 119.6 (14.4) DBP (mm Hg) = 64.8 (13.4) HR (BPM) = 79.3 (16.6) | music group averages (SD): SBP (mm Hg) = 116.8 (24.5) DBP (mm Hg) = 64.6 (11.6) HR (BPM) = 76.8 (17.6) synthetic silence group averages (SD): SBP (mm Hg) = 120.1 (16.4) DBP (mm Hg) = 68.4 (12.7) HR (BPM) = 76.4 (22.3) control group averages (SD): SBP (mm Hg) = 114.5 (25.4) DBP (mm Hg) = 63.8 (13.4) HR (BPM) = 77.3 (17.4) | decrease by 5.0 mm Hg decrease by 5.9 mm Hg decrease by 4.9 bpm decrease by 2.8 mm Hg decrease by .9 mm Hg decrease by 3.1 bpm decrease by 5.1 mm Hg decrease by 1.0 mm Hg decrease by 2.0 bpm | 6 no significance found with HR, SBP, or DBP |
| Lee et al. [28] | 85 | mean age nor range provided | Music group (n= 41): Patient were provided with music and headphones Control group (n= 44): Headphone wear, without music playing | 1 session, 30-minute | music group averages (SD): * SBP (mm Hg) = 125.76 (14.56) DBP (mm Hg) = 62.66 (6.77) * HR (BPM) = 80.22 (8.39) control group averages (SD): SBP (mm Hg) = 123.75 (15.42) DBP (mm Hg) = 63.70 (8.17) HR (BPM) = 79.34 (7.65) | music group averages (SD): * SBP (mm Hg) = 123.27 (14.49) DBP (mm Hg) = 62.80 (7.19) * HR (BPM) = 76.83 (9.98) control group averages (SD): SBP (mm Hg) = 125.64 (14.19) DBP (mm Hg) = 63.48 (8.22) HR (BPM) = 79.95 (8.15) | * decrease by 2.49 mm Hg increase by .14 mm Hg * decrease by 3.39 bpm increase by 1.89 mm Hg decrease by 0.22 mm Hg Increase by 0.61 bpm | 8 significant decrease in HR and SBP in music group. No significance found with DBP |
| To et al. [35] | 50 | mean age nor range not provided | Music group (n= 25): Subjects provided with audio device loaded with Mozart sonatas, with headphones Control group (n= 25): No music | 1 session, 240-minutes (4 h) | DBP not tested music group averages (SD): SBP (mm Hg) = 142.00 (24.10) * HR (BPM) = 94.84 (20.05) control group averages (SD): SBP (mm Hg) = 146.72 (22.62) HR (BPM) = 88.12 (14.11) | DBP not tested music group averages (SD): SBP (mm Hg) = 147.50 (23.50) * HR (BPM) = 89.42 (13.61) control group averages (SD): SBP (mm Hg) = 132.89 (30.03) HR (BPM) = 86.40 (7.31) | increase by 5.50 mm Hg * decrease by 5.42 bpm decrease by 13.83 mm Hg decrease by 1.72 bpm | 8 * significant decrease in HR no significant change in BP |
| Barnason et al. [36] | 96 | 67 | Music group (n= 32): patients self-selected between country western instrumental, Fresh Aire by Mannheim Steamroller, Winter into Spring by George Winston, Prelude by Steven Halpern, or Comfort Zone by Steven Halpern. Delivered through headphones Music video group (n= 32): Sound consisted of soft instrumental music with visual imaging on TV. Subjects wore headphones Rest group (n= 32) Subjects received undisturbed rest | All groups received 1 session (30 min) per day, × 2 days (POD 2 and POD 3) | for all groups: missing data/ values not reported for HR, SBP, DBP | for all groups: missing data/ values not reported for HR, SBP, DBP | for all groups: missing data/values not reported for HR, SBP, DBP | 6 |
| Chan et al. [37] | 66 | not given (ranged from 35–75) | Music group (n= 31): Music consisted of patient self-selection from soft, slow music without lyrics. Patients were provided with MP3 players with earphones Control group (n= 35): Uninterrupted rest period | 1 session on only 1 day for 45 min in duration | music group mean (SD): SBP (mm Hg) = 143.6 (23.9) DBP (mm Hg) = 71.7 (11.8) * HR (BPM) = 72.6 (14.3) control group averages (SD): SBP (mm Hg) = 143 (23.9) DBP (mm Hg) = 73.1 (11.6) HR (BPM) = 77 (10.8) | SBP (mm Hg) = 136.1 (21.2) DBP (mm Hg) = 72.7 (12.9) * HR (BPM) = 65.5 (17.16) control group averages (SD): SBP (mm Hg) = 141.9 (31.0) DBP (mm Hg) = 68.7 (14.6) HR (BPM) = 79.8 (11.1) | decrease of 7.5 mm Hg increase of 1 mm Hg * decrease of 7.1 BPM decrease of 1.1 mm Hg decrease of 4.4 mm Hg increase of 2.8 BPM | 6 |
| Dijkstra et al. [38] | 20 | 52.2 | Music group (n= 10) Music was patient/caregiver’s choice from “slow/ relaxing” music including classical music (Anton Bruckner, Quintet F-Dur, Adagio and Gustav Mahler, Symphony No. 4 G-Dur, Ruhevoll) and easy listening (film music, Vangelis, 1492, and songs without vocals). Patients were provided with MP3 players with headphones Control group (n=10) Received rest periods without interruption | 1–3 sessions per day for 2 days. Sessions were 30 min in duration | music group averages (SD): SBP (mm Hg) = 117.0 (16.8) DBP (mm Hg) = 62.0 (11.1) * HR (BPM) = 107 (22.6) control group averages (SD): SBP (mm Hg) = 107 (23.9) DBP (mm Hg) = 54.0 (7.6) HR (BPM) = 90.0 (14.0) | SBP (mm Hg) = 115.0 (24.9) DBP (mm Hg) = 60.0 (8.1) HR (BPM) = 107 (22.8) SBP (mm Hg) = 108 (25.6) DBP (mm Hg) = 54.0 (5.9) HR (BPM) = 91.0 (12.7) | decrease by 2 mm Hg decrease by 2 mm Hg no change increase by 1 mm Hg no change increase by 1 BPM | 6 |
| Elliott [39] | 56 | 60.6 | Music group (n= 19) Patients listened to classical music using an audiotape with headphones Muscle relaxation (MR) group (n = 18) Patients listened to verbal instructions on muscle relaxation techniques using an audiotape with headphones Control group (n=19) Uninterrupted rest | 2–3 sessions, for 30 minutes per session, over the course of one day | music group averages (SD): SBP (mm Hg) = 134 (15) DBP (mm Hg) = 73 (13) * HR (BPM) = 80 (19) MR group averages (SD): SBP (mm Hg) = 125 (22) DBP (mm Hg) = 72 (10) HR (BPM) = 68 (10) control group averages (SD): SBP (mm Hg) = 125 (16) DBP (mm Hg) = 75 (10) HR (BPM) = 76 (16) | SBP (mm Hg) = 124 (20) DBP (mm Hg) = 71 (12) * HR (BPM) = 72 (13) SBP (mm Hg) = 129 (36) DBP (mm Hg) = 71 (12) HR (BPM) = 76 (16) SBP (mm Hg) = 124 (12) DBP (mm Hg) = 75 (10) HR (BPM) = 80 (19) | decrease by 10 mm Hg decrease by 2 mm Hg decrease by 8 BPM increase by 4 mm Hg decrease by 1 mm Hg increase by 8 BPM decrease by 1 mm Hg no change increase by 4 BPM | 6 significance found in decreasing HR in music group |
| Han et al. [40] | 137 | 46.18 | Music group (n= 44) Subjects were asked to rest and provided MP3 players with headphones. Music choices ranged in 40 choices amongst 4 categories Placebo group (n = 44) Subjects were asked to rest and wore headphones without music playing Control group (n= 49) Subjects were asked to rest. Subjects neither had headphones or music | 1 session, 30-minutes | music group averages (SD): *SBP (mm Hg) = 119.77 (18.39) *DBP (mm Hg) = 70.61 (12.39) *HR (BPM) = 96.98 (15.93) placebo group averages (SD): SBP (mm Hg) = 121.82 (16.64) DBP (mm Hg) = 71.00 (13.74) HR (BPM) = 97.25 (17.83) control group averages (SD): SBP (mm Hg) = 116.78 (16.25) DBP (mm Hg) = 68.02 (12.74) HR (BPM) = 93.20 (15.49) | music group averages (SD): *SBP (mm Hg) = 114.54 (not provided) *DBP (mm Hg) = 68.2 (not provided) *HR (BPM) = 91.39 (not provided) placebo group averages (SD): SBP (mm Hg) = 118.86 (not provided) DBP (mm Hg) = 70.36 (not provided) HR (BPM) = 96.23 (not provided control group averages (SD): SBP (mm Hg) = 118.31 (not provided) DBP (mm Hg) = 68.59 (not provided) HR (BPM) = 94.53 (not provided) | * decrease by 5.23 mm Hg * decrease by 2.41 mm Hg * decrease by 5.59 bpm decrease by 2.96 mm Hg decrease by 0.64 mm Hg decrease by 1.02 bpm increased by 1.53 mm Hg increased by 0.57 mm Hg increased by 1.33 bpm | 6 * significant decrease in HR, SPB, DBP found in music group when compared to placebo and control groups |
| Iblher et al. [41] | 126 | 66.9 | Experimental group one (EG1) (n= 25) Music intervention via headphones immediately after arrival in ICU EG2 (n= 25) Like EG1, without music EG3 (n = 24) Music intervention via headphones immediately following sedation EG4 (n= 27) Like EG3, without music Control group (n= 25) Without headphones or music | 1 session, 60-minute | for all groups: missing data/ values not reported for HR, SBP, DBP | for all groups: missing data/ values not reported for HR, SBP, DBP | for all groups: missing data/values not reported for HR, SBP, DBP | 5 no significance found in HR or BP |
| Korhan et al. [42] | 60 | 45.31 | Music Group (n = not reported) Patients were provided with media players and disposable headphones Control Group (n = not reported) No music | 1 session, 90-minute intervention | for all groups: missing data/ values not reported for HR, SBP, DBP | for all groups: missing data/ values not reported for HR, SBP, DBP | for all groups: missing data/values not reported for HR, SBP, DBP | 6 * significant decrease in SBP and DBP in both groups no significant difference in HR |
| Wong et al. [43] | 20 | 58.25 | Music group (n= 20): Patients were provided audiocassette players with headphones and their choice of music from Chinese music (folk songs, with Chinese instruments, with Western instru-ments, or Buddhist music) and Western music (Western classic, Western movie music, and piano music) Control group (n= 20): Uninterrupted rest without music Each individual was both in the control and experimental group because of the design of this study being pretest/posttest crossover experimental repeated measures design | 1 session, 30-minutes i n length. There was at least 6 h, and no more than 24 h in between subjects switching from each group | for all groups: missing data/ values not reported for HR, SBP, DBP | for all groups: missing data/values not reported for HR, SBP, DBP | for all groups: missing data/values not reported for HR, SBP, DBP | 6 * significant decrease in SBP and DBP found in music group No significance found with HR |
| Guzetta [55] | 80 | 57.65 | Music Group (n= 26) Included both relaxation induction of Benson’s “respiratory one-method” and listening to musical cassette tape of their choice Relaxation group (n= 27) Modification of Benson’s “respiratory one-method” Control group (n= 27) Routine nursing care without intervention | 3 sessions over a 2-day period. Sessions were 20 min (relaxation) and 20 min (listening to music) 3 sessions over a 2-day period. Sessions were 20 min (relaxation) N/A | SBP and DBP not tested music group averages (SD): * HR (BPM) = 71.23 (12.06) relaxation group averages (SD): * HR (BPM) = 78.89 (13.27) control group averages (SD): HR (BPM) = 74.00 (14.24) | SBP and DBP not tested music group averages (SD): * HR (BPM) = 64.58 (12.67) relaxation group averages (SD): * HR (BPM) = 70.52 (10.82) control group averages (SD): HR (BPM) = 76.81 (14.17) | * decrease by 6.65 bpm * decrease by 8.37 bpm increase by 2.81 bpm | 6 * significant difference found in HR, with music and relaxation group when compared to control * music group more effective at lowering HR, when compared to relaxation group |
| Johnson et al. [56] | 40 | 71.85 | Music group (n= 20) Patients were provided with iPod shuffles and headphones Control group (n= 20) Received usual care | received music intervention for 60 min, two times per day, over a 3-day period | for all groups: missing data/ values not reported for HR, SBP, DBP | for all groups: missing data/ values not reported for HR, SBP, DBP | for all groups: missing data/values not reported for HR, SBP, DBP | 6 * significant decrease in HR, SBP, and DBP |
| Chiasson et al. [57] | 100 | 62.17 | Music group (n= 50): Live harp music played Control group (n= 50): Patients were advised to relax in their rooms | 1 session on only 1 day for 10 min in duration | music group averages (SD): SBP (mm Hg) = 112.0 (23.3) DBP (mm Hg) = 62.1 (16.0) HR (BPM) = 84.4 (16.6) control group averages (SD): SBP (mm Hg) = 116.7 (21) DBP (mm Hg) = 62.6 (11.4) HR (BPM) = 76.6 (9.6) | SBP (mm Hg) = 113.3 (22.8) DBP (mm Hg) = 61.2 (13.7) HR (BPM) = 83.0 (16.1) SBP (mm Hg) = 115.7 (20.5) DBP (mm Hg) at posttest = 61.2 (12.0) HR (BPM) = 76.6 (9.8) | increase by 1.3 mm Hg decrease by 0.9 mm Hg decrease by 0.5 BPM decrease by 1 mm Hg decrease by 1.4 mm Hg no change | 7 |
| Lee et al. [59] | 64 | 69.4 | Music group (n= 32): Instructed to close their eyes and rest, in addition to Cd player with headphones Control group (n= 32): Instructed to close their eyes and rest | 1 session, 30-minutes | music group averages (SD): * SBP (mm Hg) = 133.6 (26.6) * DBP (mm Hg) = 61.3 (12.8) * HR (BPM) = 98.5 (18.2) control group averages (SD): SBP (mm Hg) = 129.0 (22.2) DBP (mm Hg) = 61.2 (12.5) HR (BPM) = 97.8 (21.9) | music group averages (SD): * SBP (mm Hg) = 129.1 (24.7) * DBP (mm Hg) = 57.8 (11.5) * HR (BPM) = 94.7 (17.5) control group averages (SD): SBP (mm Hg) = 126.0 (18.9) DBP (mm Hg) = 58.5 (11.1) HR (BPM) = 97.6 (22.2) | * decrease by 4.5 mm Hg * decrease by 3.5 mm Hg * decrease by 3.8 bpm decrease by 3.0 mm Hg decrease by 2.7 mm Hg decrease by 0.02 bpm | 7 significant decrease in HR, SBP, and DBP in music group |
| Mateu-Capell et al. [60] | 75 | 68.6 | Group A: Sound isolation followed by music. Group B: Music followed by sound isolation. Sound isolation administration: Active noise cancelling headphones, used to reduce noise up to 15 dB Music administration: An MP3 player was used with headphones | 1 session, 4 h group A: 1sth (baseline), 2ndh (sound isolation), 3rdh (music), 4thh (rest) group B: 1sth (baseline), 2ndh (music), 3rdh (sound isolation), 4thh (rest) | for all groups: missing data/ values not reported for HR, SBP, DBP | for all groups: missing data/ values not reported for HR, SBP, DBP | for all groups: missing data/values not reported for HR, SBP, DBP | 7 no significance found |
| White [61] | 45 | 63 | Music group (n= 15): Patients were provided with a quiet, restful environment, and choice from preselected, classical music on CD players with headphones Attention group (n=15): Patients were provided with a quiet, restful environment Control group (n=15): Treatment as usual | 1 session, 20-minutes in length | DBP not tested music group averages (SD): SBP (mm Hg) = 119.0 (4.5) * HR (BPM) = 79.3 (5.2) attention group averages (SD): SBP (mm Hg) = 124.0 (6.0) HR (BPM) = 79.2 (2.9) control group averages (SD): SBP (mm Hg) = 119.0 (5.3) HR (BPM) = 77.1 (4.9) | DBP not tested music group averages (SD): SBP (mm Hg) = 115.0 (4.0) * HR (BPM) = 70.5 (3.9) attention group averages (SD): SBP (mm Hg) = 122.0 (5.0) HR (BPM) = 74.0 (2.7) control group averages (SD): SBP (mm Hg) = 121.0 (2.6) HR (BPM) = 79.6 (5.4) | decrease by 4 mm Hg * decrease by 8.8 bpm decrease by 2.0 mm Hg decrease by 5.2 bpm increase by 2 mm Hg increase by 2.5 bpm | 6 significant decrease in HR found in music group |
| Yaman et al. [62] | 66 | mean age not provided age ranged from 36-67 | Music group (n= 33): Patients were provided with MP3 players connected to 2 loudspeakers inside a pillow (Creatone music pillow) Control group (n= 33): Patients were provided a pillow without loudspeakers, no music | 1 session, 60-minutes in length | music group averages (SD): SBP (mm Hg) = 125.12 (14.18) DBP (mm Hg) = 65.67 (11.43) HR (BPM) = 86.18 (12.47) control group averages (SD): SBP (mm Hg) = 120.24 (20.23) DBP (mm Hg) = 63.79 (9.03) HR (BPM) = 86.18 (12.30) | music group averages (SD): SBP (mm Hg) = 118.91 (15.81) DBP (mm Hg) = 63.48 (11.52) HR (BPM) = 87.81 (9.90) control group averages (SD): SBP (mm Hg) = 114.94 (17.77) DBP (mm Hg) = 62.30 (10.87) HR (BPM) = 89.28 (9.88) | decrease by 6.21 mm Hg decrease by 2.19 mm Hg increase by 1.69 bpm decrease by 5.3 mm Hg decrease by 1.49 mm Hg increase by 3.12 bpm | 6 no significance found with HR, SBP, or DBP |
| Average | 6.33 |
Methodological quality
The PEDro scale is based on the Delphi list developed by Verhagen and colleagues at the Department of Epidemiology, University of Maastricht. The purpose of the PEDro scale is to assist researchers of the PEDro database to rapidly identify which of the known randomised clinical trials are likely to be internally valid (criteria 2–9) and could have sufficient statistical information to make their results interpretable (criteria 10–11). PEDro scores ranged from 5 to 8 out of 10 points (average = 6.33 pts.). Five of the 18 included trials showed a high methodological quality with minimal risk of bias (PEDro score > 7), and 13 of 18 included trials presented a moderate risk of bias with PEDro scores ranging from 5 to 6 (Table 2). Because only RCTs were accepted as eligible, all trials fulfilled the criteria of randomisation, but only one reported concealed allocation procedures for group assignment [35]. Study groups were comparable at baseline in all trials, and point estimates as well as measures of variability were presented. None of the trials reported blinding of participants or care providers (secondary to the music intervention). However, nine trials [14, 36–43] reported blinding of all assessors. Most articles demonstrated adequate follow-up; all 18 articles conducted their analyses based on intention-to-treat principles.
Table 2
Quality assessment (PEDro) of included studies
| Studies | Eligibility criteria | Random allocation | Concealed allocation | Baseline comparison | Blind subjects | Blind therapist | Blind assessors | Adequate follow-up | Intention to treat | Between groupcomparison | Point estimatesvariability | PEDro score | ||
|---|---|---|---|---|---|---|---|---|---|---|---|---|---|---|
| Barnason et al. [36] | Y | Y | N | Y | N | N | N | Y | Y | Y | Y | 6 | ||
| Chan et al. [37] | Y | Y | N | Y | N | N | N | Y | Y | Y | Y | 6 | ||
| Chiasson et al. [57] | Y | Y | N | Y | N | N | N | Y | Y | Y | Y | 7 | ||
| Dijkstra et al. [38] | Y | Y | N | Y | N | N | N | Y | Y | Y | Y | 6 | ||
| Elliot [39] | Y | Y | N | Y | N | N | N | Y | Y | Y | Y | 6 | ||
| Guzzetta [55] | Y | Y | N | Y | N | N | N | Y | Y | Y | Y | 6 | ||
| Han et al. [40] | Y | Y | N | Y | N | N | N | N | Y | Y | Y | 6 | ||
| Iblher et al. [41] | Y | Y | N | Y | N | N | N | N | Y | Y | Y | 5 | ||
| Johnson et al. [56] | Y | Y | N | Y | N | N | N | Y | Y | Y | Y | 6 | ||
| Korhan et al. [42] | Y | Y | N | Y | N | N | N | Y | Y | Y | Y | 6 | ||
| Lee et al. [28] | Y | Y | Y | Y | N | N | Y | Y | Y | Y | Y | 8 | ||
| Lee et al. [59] | Y | Y | N | Y | N | N | Y | Y | Y | Y | Y | 7 | ||
| Mateu-Capell et al. [60] | Y | Y | N | Y | N | N | Y | Y | Y | Y | Y | 7 | ||
| To et al [35] | Y | Y | N | Y | N | Y | Y | Y | Y | Y | Y | 8 | ||
| White et al. [61] | Y | Y | N | Y | N | N | N | Y | Y | Y | Y | 6 | ||
| Wong et al. [43] | Y | Y | N | Y | N | N | N | Y | Y | Y | Y | 6 | ||
| Yaman et al. [62] | Y | Y | N | Y | N | N | N | Y | Y | Y | Y | 6 | ||
| Zimmerman et al. [14] | Y | Y | N | Y | N | N | N | Y | Y | Y | Y | 6 | ||
| Average | 6.33 | |||||||||||||
Effects of music intervention
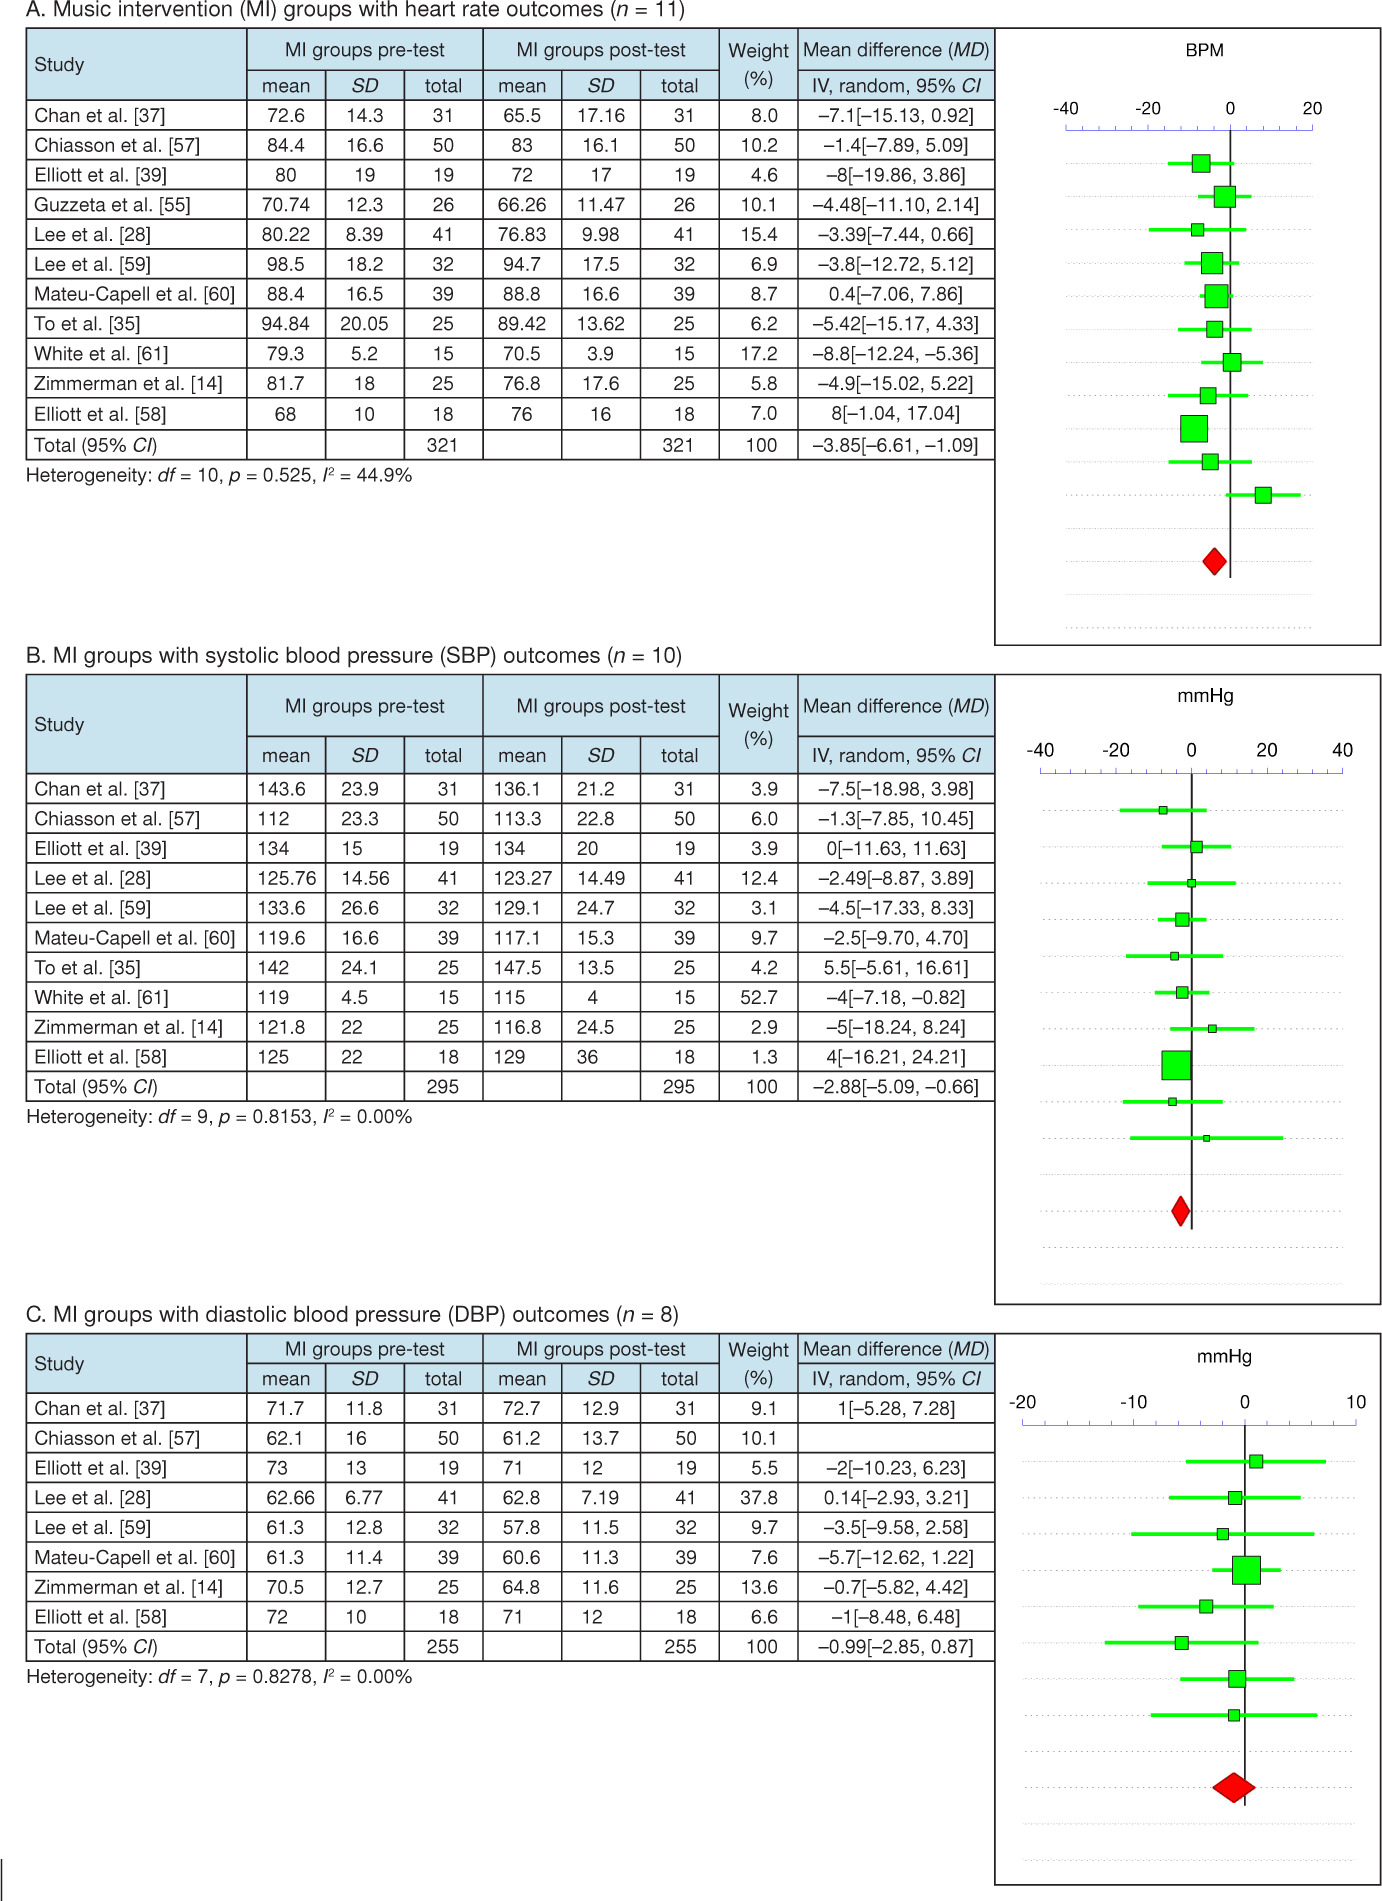
Statistically significant between-group differences were reported in 9 studies (average PEDro score = 6.56) for at least one primary outcome, with 7/14 studies for HR, 4/14 studies for SBP, and 2/11 studies for DBP, in favour of the music intervention groups. In the meta-analysis, 7–10 studies were excluded from the subgroup analyses for not containing the necessary data on statistical tests (i.e., means and standard deviations). Subgroup meta-analysis of music intervention groups showed small improvements in overall MDs from pre- to post-intervention for HR (n = 11, MD = −3.85 BPM, 95% CI [−6.61, −1.09]), SBP (n = 10, MD = −2.88 mm Hg, 95% CI [−5.09, −0.66]), and DBP (n = 9, MD = −0.99 mm Hg, 95% CI [−2.85, 0.87]). Table 3 illustrates the post-test outcomes of the subgroup analyses for the music intervention groups. In these forest plots, diamonds that fall on the left-side of the vertical zero line represent group means for participants who received the music intervention in one study and showed post-test reductions compared to pre-test values. The large diamonds at the bottom of each graph represent the average MDs of all trials and should be interpreted the same way. No statistical heterogeneity (I2) was observed in each of these comparisons (see Table 3).
Table 3
Overall meta-analysis of music intervention (MI) subgroups for each primary outcome: (A) heart rate (HR), (B) systolic blood pressure (SBP), (C) diastolic blood pressure (DBP)
 |
Several studies included common secondary outcomes, which were assessed before and after music administration. Based on subgroup analyses, statistically significant improvements were found for anxiety (STAI; n = 8, MD = −7.16 pts, 95% CI [−10.75, −3.58]) and respiratory rate (n = 8, MD = −1.52 BPM, 95% CI [−2.65, −0.40]) following intervention. Secondary outcomes were not included in the meta-analysis because they were already discussed within the current literature.
Discussion
The analysis of selected RCTs allowed the authors to present the impact of music on physiological aspects of patients in an ICU. Current findings are consistent with past studies showing that music influences lowering blood pressure and heart rate in various stressful and non-stressful settings outside an ICU [44]. Medical practitioners continue to strive for improvements in quality care, and even the slightest reduction in HR and BP can be extremely beneficial to ICU patients who are often critically ill.
It should be noted that there is a difference between music therapy and music listening. Music therapy involves using music interventions by trained therapists to achieve specific therapeutic goals [45]. Many of these interventions include listening to music, playing instruments, singing, and song-writing. Here, the therapeutic process is tailored to the individual’s needs, making it a highly personalised approach to healing [46]. In contrast, music listening is a more generalised approach that can be administered by any non-trained individual, where a subject listens to music to relax. Typically, the subject can choose from their preferred music genre; however, a form of classical music is often utilised, as was the case in this study.
All studies incorporated within this review utilised classical music or soft instrumental music resembling a classical genre. The dosage of music listening varied across the studies, ranging from 10 to 240 min. In 13 of 18 studies, participants received one session of music listening, ranging in length from 10 to 240 min. In 5 of 18 studies, participants received music listening for 2–3 sessions, ranging from 30 to 40 min over the course of 1–3 days. Whether being one session or several sessions, no matter the length of time, music listening at any interval proves to have a positive effect on critically ill patients within an ICU setting.
The findings of this systematic review show small changes in blood pressure and heart rate to be significant. Improvement of vital signs by even the smallest bit may determine a better prognosis in patients who are critically ill, especially within an ICU setting where vital signs can be fragile [47]. Vital signs are regarded as an essential part of monitoring ICU patients. Changes in vital signs may play a role in the prevention or early detection of deterioration for some patients [48]. Therefore, even the slightest changes could impact larger health outcomes.
Overall, there remains limited evidence supporting the beneficial effects of music listening on decreasing HR and BP in patients in an ICU setting. As changes in safety parameters should be monitored closely during each session of critical care, early intervention with patient-preferred music may be beneficial to maintain stable vitals and reduce anxiogenic feelings during patient care.
Limitations
The present study had several limitations. All studies selected based on the inclusion criteria utilised music listening. Further research is warranted to examine the effects of music listening versus music therapy on HR and BP for patients in the ICU. In addition, publication bias is shown in this study, as the authors only included RCTs to strengthen their understanding of the results.
In addition, there were variations in the genre and duration of music that was played across the studies. Although most research on the effects of music on patients in the ICU used classical music, further empirical testing is required to determine which genre of music provides the most effective benefits on HR and BP (e.g., jazz, easy listening). There were also variations in music characteristics (tempo, complexity, intensity, etc.). Further research is required to determine the efficacy of music listening methodology comparing music genre versus music characteristics.
Lastly, the duration, frequency, and number of sessions varied widely. Listening to music for a longer duration and with greater frequency may have a bigger impact on HR and BP. With respect to patient characteristics, medical diagnoses and pharmacological interventions were not uniform between the studies, with some studies emphasising the setting rather than the medical condition to define the sample. Lastly, there was a lack of long-term follow-up. The long-term effects of implementing a program of music as a strategy to reduce anxiety and control safe vital sign ranges for patients in the ICU require further investigation.
Conclusions
There is moderate strength, mixed evidence regarding the impact of listening to music on resting vitals for patients in the ICU, with the majority (n = 9) reporting significant improvements in HR and/or BP. The mixed findings may be attributed to the instability of vital signs as an indicator of health status in a critical care setting. Both HR and BP can be affected based on numerous confounding factors, including pathological medical conditions, pharmacological management, and/or anxiety. Therefore, aggregate data may not capture the impact of individual diagnoses on patients’ responsiveness to music interventions.
The average change from pre- to post-intervention varied widely, ranging from −8.80 to +2.80 BPM for HR, −10.00 to +5.50 mm HG for SBP, and −8.80 to +2.80 mm HG for DBP. Many group mean values were already within normal ranges at baseline, which may explain the lack of major reductions. However, even slight changes may represent clinical significance if a clinician is performing procedures that impact haemodynamic stability. According to recent clinical practice guidelines, relative contraindications for clinicians attempting to mobilise patients in the ICU include a HR outside of 40–130 bpm [49, 50] and mean arterial pressure (MAP) outside of 60–110 mm Hg [51, 52]. As a result, a short bout of playing music may reduce or maintain vitals within acceptable ranges for implementing bedside care. Music may also distract patients from focusing on the panicogenic sounds coming from the ICU, thereby reducing anxiety [53].
With respect to clinical utility, playing music in a critical care setting may provide a feasible, cost- and time-effective means for clinicians attempting to lower HR and/or BP. Furthermore, music interventions appeared safe, as no adverse events were reported across all studies. Most studies used low-cost, portable devices with headphones to play the music.
Set-up did not require significant time or effort, apart from some studies allowing patients to select their own type of music. In setting treatment parameters, allowing patients to select a favoured, self-selected genre of music may also impact outcomes [54]. For those studies that allowed a choice of music (n = 8) HR improvements ranged from −3.8 to −7.1 BPM while SBP improvements ranged from −2.0 to −7.5 mm Hg, and DBP ranged from 1.0 to −5.9 mmHg [14, 36–38, 40, 43, 55, 56]. Therefore, clinicians may consider allowing patients to choose the type of music that is played during interventions.